If you’ve met Bollinger Bands, Keltner Channels will feel familiar: a middle line with a band above and below that widen and narrow with volatility. The difference is what sets the width. Bollinger uses standard deviation; Keltner uses the Average True Range. That one swap gives Keltner a smoother, calmer personality. Let’s do the math.
The one-sentence job
Keltner Channels wrap price in a channel centered on a moving average, with the band width set by ATR (a volatility measure). Price near the upper band is strong; near the lower band, weak; and the channel breathes with volatility.
The formula (modern version)
The version everyone uses today, with defaults of 20 and 2:
Middle = 20-period EMA of close
Upper  = Middle + 2 × ATR
Lower  = Middle − 2 × ATR
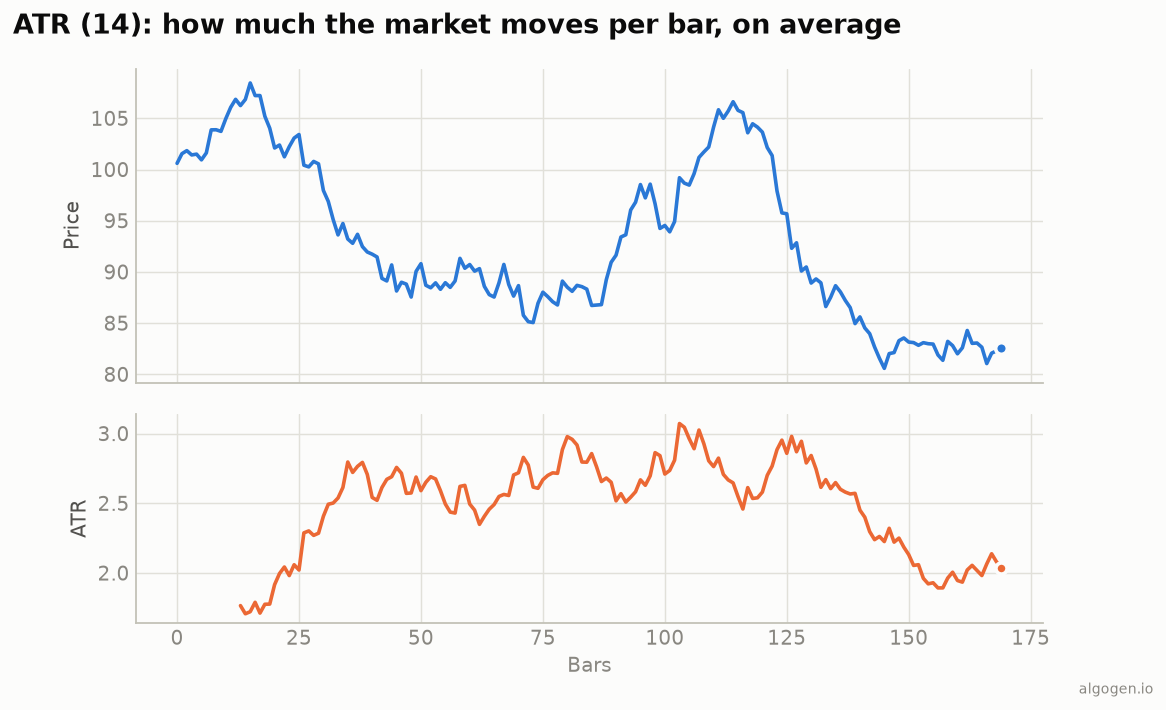
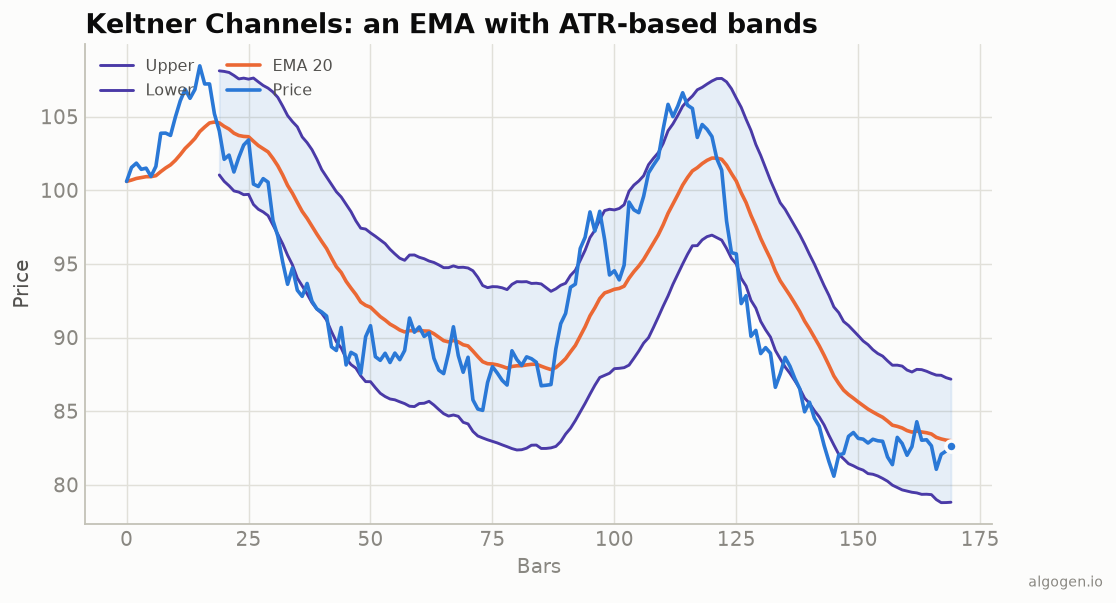
The centerline is an exponential moving average, and the bands sit a multiple of ATR above and below it. Because ATR is a smoothed measure of the true bar range, the channel expands in volatile periods and contracts in quiet ones — visible in the chart above.
(There’s also Keltner’s original 1960 formula, which used a simple moving average of typical price and bands based on the high-low range. The ATR/EMA version here is the modern standard — see the history.)
Keltner vs Bollinger — the key difference
They look like twins, but the volatility engine differs and it matters:
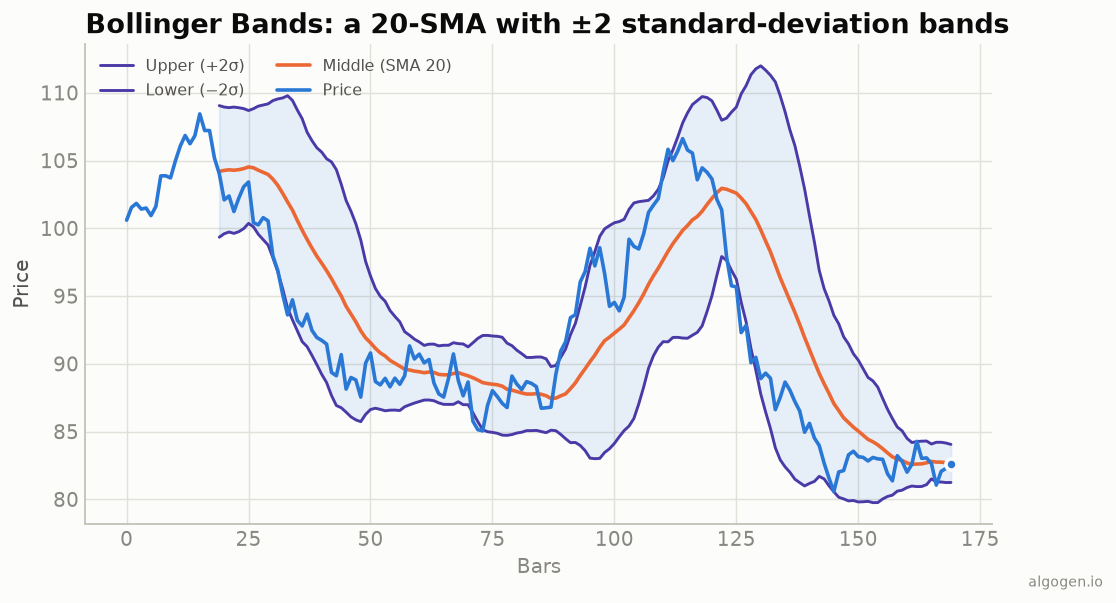
- Bollinger uses standard deviation, which reacts sharply to sudden price spikes — the bands can jump. More responsive, more whipsaw.
- Keltner uses ATR, which is smoothed — the bands are steadier and less jumpy. Calmer, fewer false pokes.
Neither is “better.” Bollinger reacts faster; Keltner is smoother. Many traders watch both.
How to read it
Trend riding. In a strong trend, price hugs or “rides” the upper band (up) or lower band (down). Unlike a naive mean-reversion read, touching the Keltner band in a trend is a sign of strength, not an automatic reversal.
Breakouts. A close outside the channel can signal a volatility breakout — momentum strong enough to escape the normal range.
Pullbacks to the middle. In a trend, price often pulls back to the EMA centerline and resumes; the middle line acts as dynamic support/resistance.
The squeeze (Keltner + Bollinger together). One of the most popular uses isn’t Keltner alone — it’s combining it with Bollinger Bands. When the Bollinger Bands contract inside the Keltner Channels, volatility is unusually low: a squeeze, often preceding a big move. This is the basis of the well-known “TTM Squeeze” setup. It works because the two react differently to volatility, so their relative width is informative.
The settings
Common defaults: a 20-period EMA with bands at 2 × ATR (ATR period often 10 or 20). Wider multipliers give roomier channels; shorter EMAs react faster. As ever, these are starting points to test, not laws.
The 1960 original, for the curious
If you want to reproduce Keltner’s actual 1960 rule rather than the modern
version, it’s: a 10-day SMA of typical price (H+L+C)/3 as the centerline, with
bands set by adding and subtracting a 10-day SMA of the high-low range. It’s a
perfectly usable channel and worth trying, but be aware it will look different from
the EMA/ATR version everyone else is running — so when you compare notes, make sure
you’re comparing the same formula.
Where it lies to you
- It lags. Built from an EMA and ATR, Keltner confirms rather than predicts.
- Band touches aren’t reversals in trends. Fading a Keltner band touch during a strong trend is a classic way to get run over.
- Parameter sensitivity. The EMA length, ATR length, and multiplier all change the channel’s character; don’t assume one setting fits every market.
Keltner Channels are a clean, smooth volatility envelope — the “calm sibling” to Bollinger’s more excitable bands. Used for trend context, breakouts, and especially the squeeze, they earn their place; used as a blind fade-the-band signal, they’ll disappoint.
Now go test it, don’t trust it
Does a Keltner breakout — or a Bollinger-inside-Keltner squeeze — actually pay on your market? That’s a backtest, not a debate. Build it in AlgoGen and read the equity curve. Then build the channel yourself in Python, MQL5, Pine Script, EasyLanguage, or NinjaScript.
This post is educational, not financial advice. Indicators describe the past; they don’t predict the future. Backtest anything before you risk real money on it.