The Simple Moving Average has one quirk that bugs a lot of traders: it treats the price from 20 bars ago as exactly as important as today’s price. When that old bar finally drops out of the window, the average can lurch for no reason related to what’s happening now. The Exponential Moving Average is the fix. It weights recent prices more heavily and lets old ones fade away smoothly. Let’s do the math.
The one-sentence job
The EMA is a moving average that gives more weight to recent prices and exponentially less to older ones. No price ever fully “drops out” — it just matters less and less. The result is a line that hugs price more closely and turns faster than a simple average of the same length.
The formula
The EMA is defined recursively — today’s value depends on yesterday’s:
EMA_today = α × Price_today + (1 − α) × EMA_yesterday

where α (the smoothing factor) = 2 / (N + 1)
For a 20-period EMA, α = 2 / 21 ≈ 0.095. So each new bar contributes about 9.5% of the new EMA value, and the entire prior history contributes the other ~90.5% — with each older bar’s influence shrinking geometrically. That “geometric fade” is the whole idea, and it’s why it’s called exponential.
You have to start the recursion somewhere. Most implementations seed the first value with either the first price or a simple average of the first N prices; the choice only affects the earliest bars before everything converges (a detail we handle carefully in the code posts).
EMA vs SMA
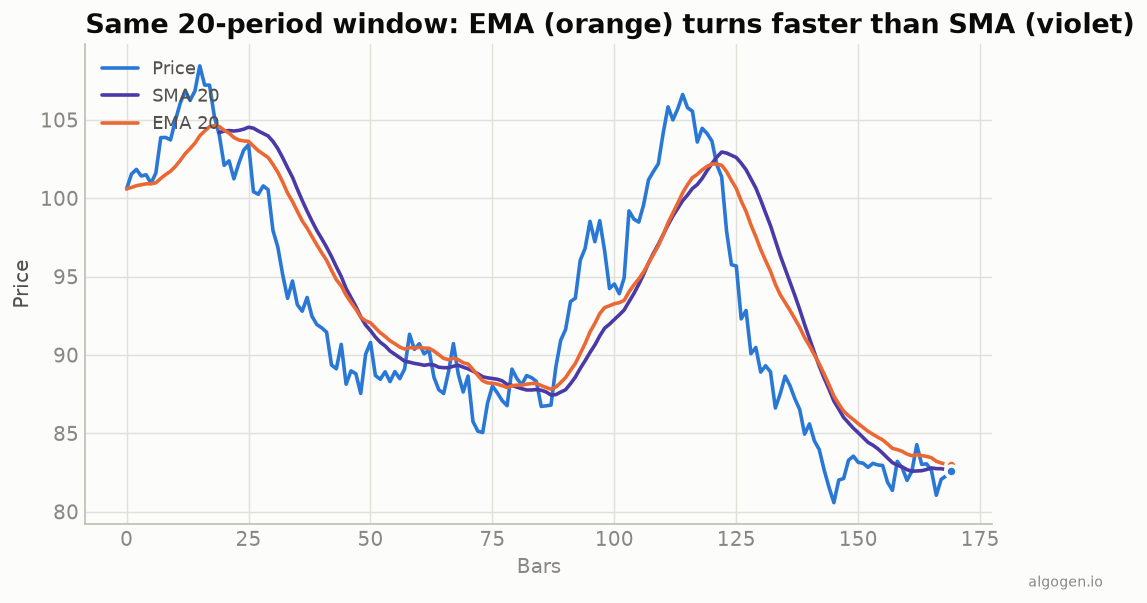
Look at the chart above: the EMA (orange) and SMA (violet) both use a 20-bar window, but the EMA clings to price and pivots sooner at every turn, while the SMA lags behind. That responsiveness is the EMA’s selling point — and also its downside.
- EMA: less lag, reacts sooner to real turns, but also reacts sooner to noise — more false signals in choppy markets.
- SMA: more lag, smoother, ignores short-term jitter better, but late to real reversals.
Neither is “better.” They’re different points on the lag-versus-noise dial.
How to read it
Everything you do with an SMA you can do with an EMA, just faster:
- Direction and slope — price above a rising EMA is an uptrend.
- Dynamic support/resistance — pullbacks to the EMA in a trend.
- Crossovers — a fast EMA crossing a slow EMA (the classic 12/26 pairing lives at the heart of the MACD, which is built entirely from EMAs).
The EMA’s speed makes it the default choice when you care about catching turns early and are willing to tolerate a few more false alarms.
The settings
Common EMAs are 9, 12, 20, 26, 50, and 200. Short EMAs (9, 12) are twitchy and popular for fast entries; the 200-day EMA plays a similar big-picture role to the 200-day SMA. If you want even less lag, there are EMA-derived averages (DEMA, TEMA, Hull) that combine EMAs to react faster still — but they buy responsiveness with even more sensitivity to noise, so they’re not a free lunch. As always: a starting point, not a commandment — test it.
Where it lies to you
- It still lags. Less than the SMA, but it’s still built from history and will always confirm a turn rather than predict it.
- It overreacts to spikes. Because recent bars are weighted heavily, a single violent bar yanks the EMA more than it would an SMA.
- More whipsaws. In a flat market the EMA’s responsiveness works against you, generating more false crossovers than a slow SMA would.
The EMA is the SMA’s faster sibling: same job, quicker reflexes, a little more jumpy. Pick it when responsiveness matters more than smoothness — and prove which one actually works on your market rather than arguing about it.
Now go test it, don’t trust it
Whether an EMA beats an SMA on the thing you trade is an empirical question with a concrete answer. Drop both into AlgoGen, run them on real history, and compare the equity curves. Then build the EMA yourself in Python, MQL5, Pine Script, EasyLanguage, or NinjaScript.
This post is educational, not financial advice. Indicators describe the past; they don’t predict the future. Backtest anything before you risk real money on it.
Sources and further reading
- Statistical Forecasting for Inventory Control (Royal Statistical Society and Oxford Academic)