Keltner Channels in EasyLanguage are two familiar functions — XAverage and
AvgTrueRange — combined into a channel. See
the explainer for the concept.
What you’ll need
- TradeStation or MultiCharts
- The EasyLanguage / PowerLanguage Editor, new Indicator
The source
{ AlgoGen Keltner Channel — TradeStation / MultiCharts }
inputs:
    EmaLen( 20 ),
    AtrLen( 10 ),
    Mult( 2.0 );

variables:
    Mid( 0 ), Band( 0 ), UpB( 0 ), LoB( 0 );

Mid  = XAverage( Close, EmaLen );
Band = Mult * AvgTrueRange( AtrLen );
UpB  = Mid + Band;
LoB  = Mid - Band;

Plot1( Mid, "Middle" );
Plot2( UpB, "Upper" );
Plot3( LoB, "Lower" );
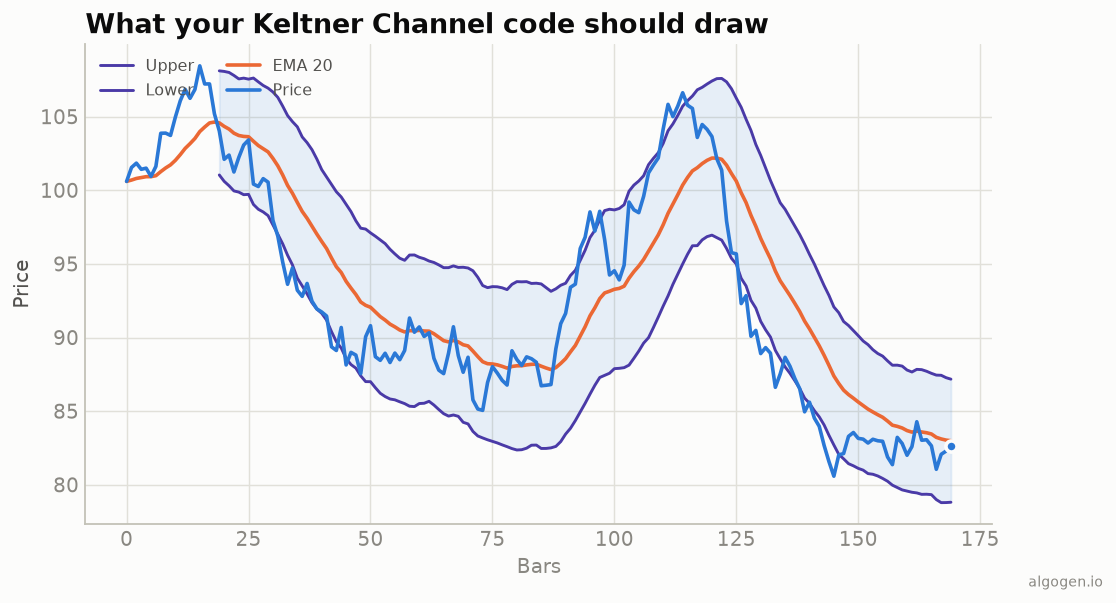
XAverage is the EMA centerline and AvgTrueRange supplies the volatility for the
bands — the modern Keltner from the output chart.
A channel-breakout strategy
{ AlgoGen Keltner Breakout — Strategy }
inputs: EmaLen( 20 ), AtrLen( 10 ), Mult( 2.0 );
variables: Mid( 0 ), UpB( 0 ), LoB( 0 );

Mid = XAverage( Close, EmaLen );
UpB = Mid + Mult * AvgTrueRange( AtrLen );
LoB = Mid - Mult * AvgTrueRange( AtrLen );

if Close crosses over UpB then Buy next bar at market;
if Close crosses under LoB then SellShort next bar at market;
{ Exit back at the centerline }
if MarketPosition = 1 and Close crosses under Mid then Sell next bar at market;
if MarketPosition = -1 and Close crosses over Mid then BuyToCover next bar at market;
This rides breakouts out of the channel and exits on a return to the EMA — run the Strategy Performance Report to see if it holds up.
Gotchas
XAverage, notAverage. The modern Keltner uses an exponential centerline;Averagegives the older SMA style.AvgTrueRangefor the bands. That’s what makes it a Keltner (ATR) rather than a Bollinger (standard deviation) channel.- Separate lengths. EMA and ATR periods are commonly different; keep both as inputs.
- The squeeze. For the Bollinger-inside-Keltner squeeze, also compute
BollingerBand-style ±2StandardDevbands and flag when they sit inside the Keltner bands —UpperBB < UpB and LowerBB > LoB. That compression often precedes the breakout the strategy above trades. - RadarScreen. Plotting the channel width (
UpB - LoB) as a column lets you scan a watchlist for the tightest (most coiled) instruments.
Same indicator elsewhere: Python, MQL5, Pine Script, NinjaScript. Then backtest it in AlgoGen.
This post is educational, not financial advice. Indicators describe the past; they don’t predict the future. Backtest anything before you risk real money on it.
Sources and further reading
- What is EasyLanguage? (TradeStation)