Most indicators try to tell you which way price is going. The Average True Range does something more modest and, honestly, more reliable: it tells you how far price tends to move, regardless of direction. It’s a volatility ruler. And once you have a good volatility ruler, you can size positions and place stops like a grown-up instead of guessing. Let’s do the math.
The one-sentence job
ATR measures the average size of a bar’s price range, including overnight gaps. Big ATR means the market is swinging around a lot; small ATR means it’s quiet. It says nothing about up or down — just magnitude.
True Range: the clever bit
The naive way to measure a bar’s movement is high minus low. The problem: that ignores gaps. If a market closes at 100 and gaps down to open at 90, a bar measured only high-to-low badly understates how much really moved. Wilder fixed this with True Range, the largest of three distances:
True Range = max of:
  1. High − Low                    (this bar's range)
  2. |High − Previous Close|       (gap up from last close)
  3. |Low − Previous Close|        (gap down from last close)
By including the previous close, True Range captures the full move even when price gaps overnight or on a limit day. It’s a small idea that makes the measure honest.
A quick worked example
Say yesterday’s close was 100. Today the stock gaps down and trades between 88 and 93. The three candidates are:
High − Low                = 93 − 88 = 5
|High − Previous Close|   = |93 − 100| = 7
|Low − Previous Close|    = |88 − 100| = 12   ← the winner
True Range is 12, not the 5 you’d get from high-minus-low. The gap down of 12 points is the real move, and True Range captures it. That single correction is why ATR doesn’t get fooled on the days that matter most.
From True Range to ATR
The Average True Range is simply a smoothed average of the True Range, using
Wilder’s smoothing (the same 1/N running average as the RSI),
with a default period of 14:
ATR = Wilder-smoothed average of True Range over N bars
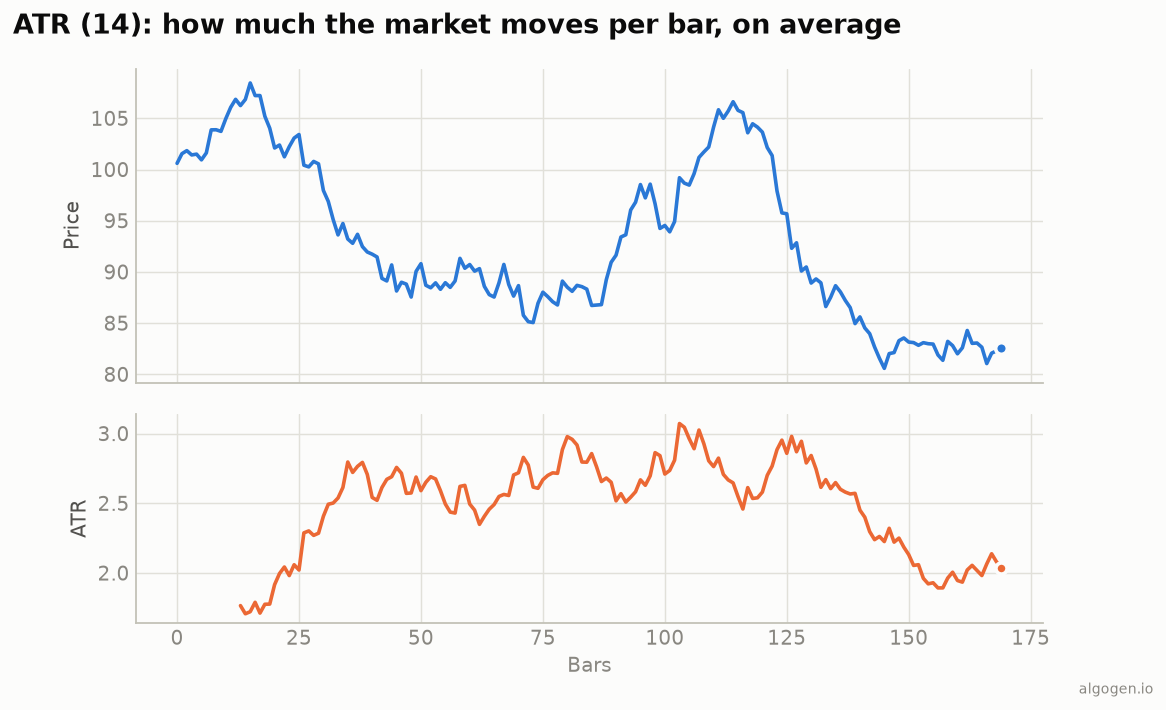
On the chart above, notice the ATR (orange) rises when price is thrashing around and falls when it settles into a quiet drift. It’s not bounded like an oscillator — it’s measured in the price units of the instrument (dollars, points, pips), which matters for how you use it.
How to use it
ATR isn’t a buy/sell signal; it’s an input to risk decisions:
- Stop placement. Instead of a fixed “20-point stop,” use a volatility-scaled stop like 2× or 3× ATR. In a calm market that’s tight; in a wild market it’s wide — automatically, which is exactly what you want. The Chandelier Exit and Wilder’s own volatility stop are built on this.
- Position sizing. Risk a fixed dollar amount per trade by sizing the position
so that
shares × (ATR-based stop distance)equals your risk budget. This is the backbone of volatility-based (“risk parity”-style) sizing and how a lot of professional trend-followers normalize risk across markets. - Regime filters. Rising ATR flags expanding volatility; some systems only take breakout trades when ATR is expanding.
Where it lies to you
- No direction. ATR tells you the size of moves, never the direction. A high ATR bull market and a high ATR crash look identical to it.
- Absolute units. An ATR of 2.0 means something totally different on a $20 stock than a $2,000 one. To compare across instruments, normalize (e.g. ATR as a percentage of price).
- It lags. Being a smoothed average, ATR reacts to a volatility spike with a delay, and stays elevated for a while after things calm down.
ATR is one of the most useful non-glamorous tools you’ll ever plot. It won’t tell you what to buy, but it’ll help you not blow up when you do — which, over a long enough horizon, matters far more.
Now go test it, don’t trust it
The right way to use ATR is inside a risk rule, and the right way to judge a risk rule is to backtest it. Try ATR-based stops and sizing in AlgoGen and see what it does to your drawdowns. Then build ATR yourself in Python, MQL5, Pine Script, EasyLanguage, or NinjaScript.
This post is educational, not financial advice. Indicators describe the past; they don’t predict the future. Backtest anything before you risk real money on it.
Sources and further reading
- New Concepts in Technical Trading Systems (Windsor Books)