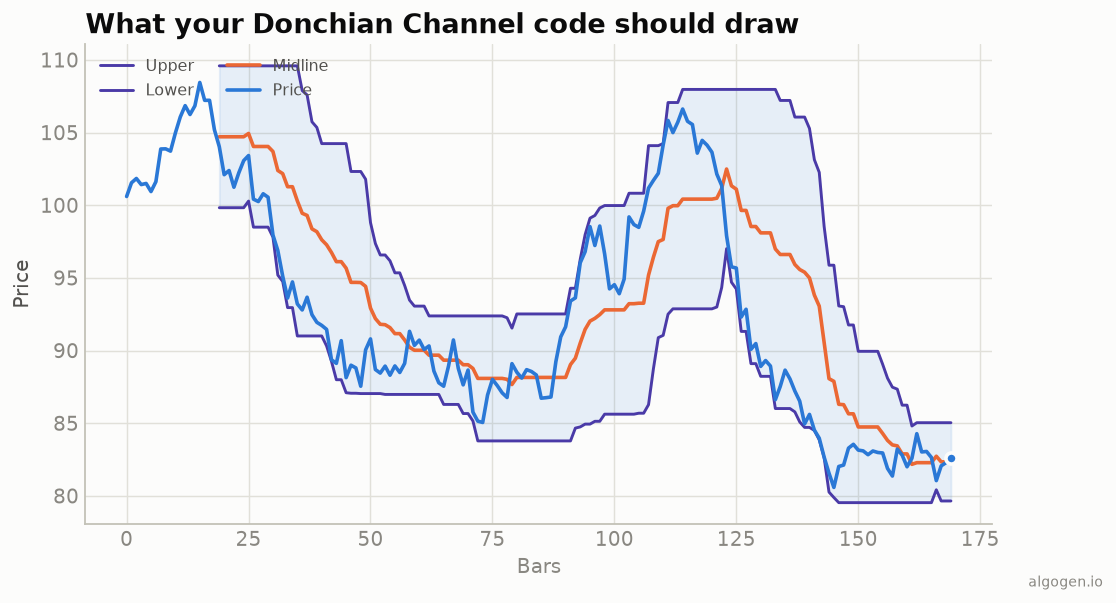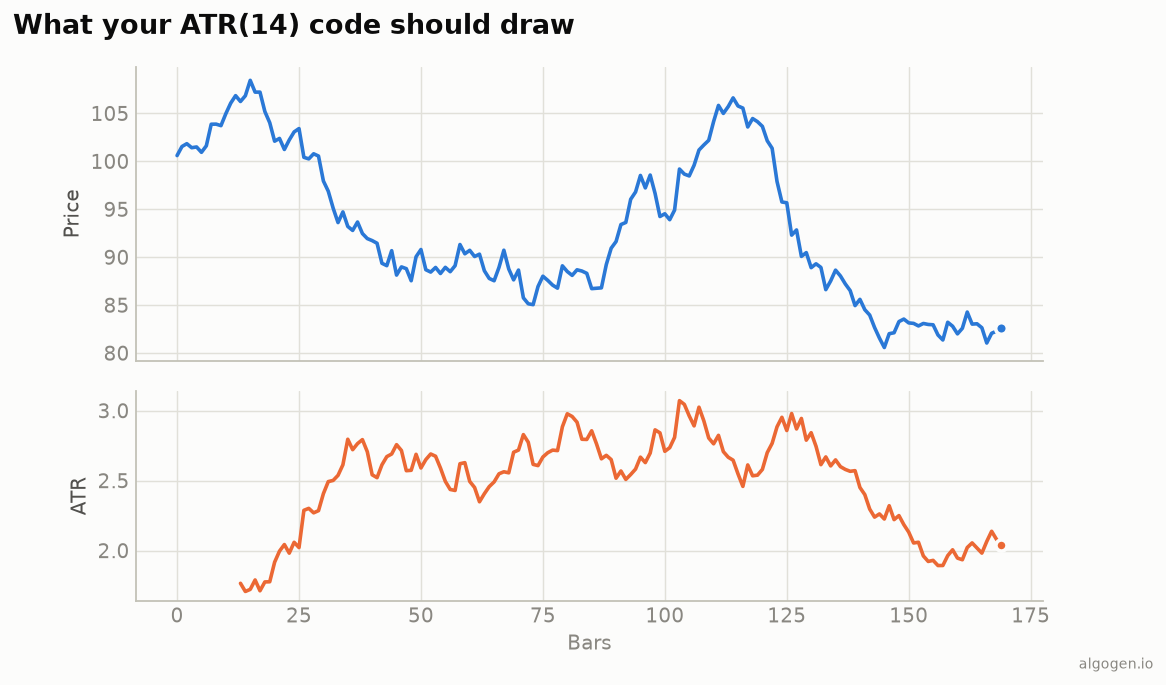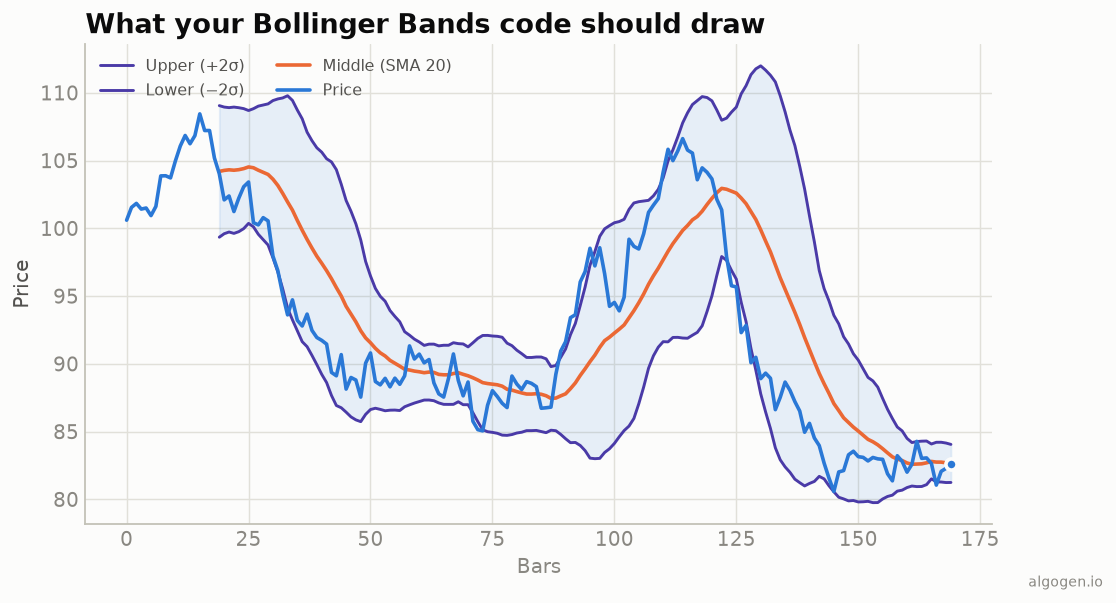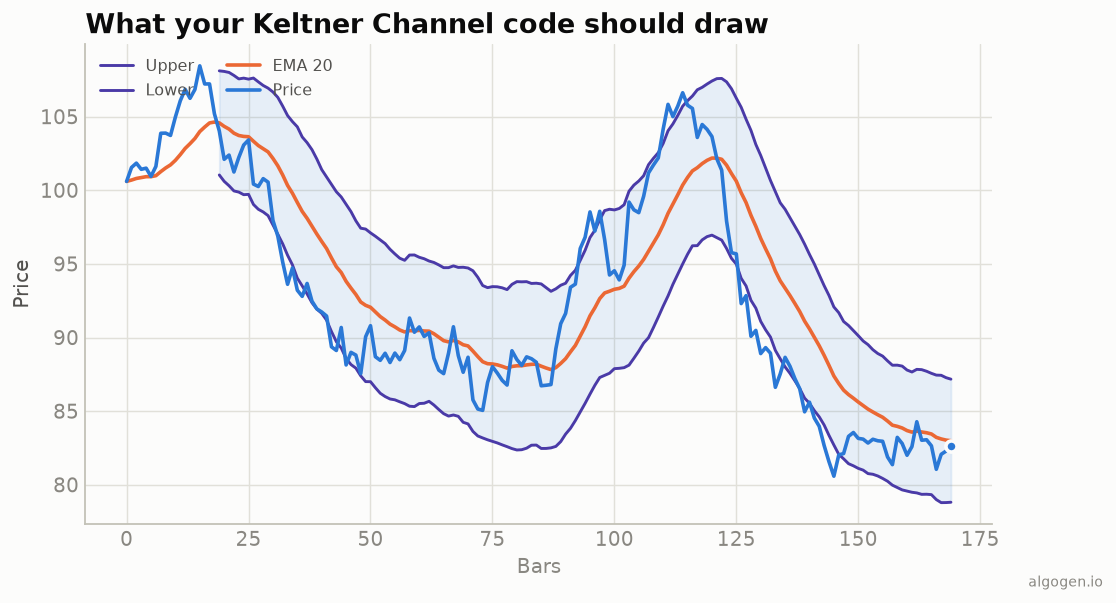
Pine has ta.kc for Keltner Channels, and combining it with ta.bb gives you the
famous squeeze in a few lines. See the explainer
for the concept.
What you’ll need
- A TradingView account (free tier is fine)
- The Pine Editor
The source
//@version=5
indicator("AlgoGen Keltner", shorttitle="AG KC", overlay=true)

emaLen = input.int(20, "EMA length")
mult   = input.float(2.0, "ATR mult")
atrLen = input.int(10, "ATR length")

mid = ta.ema(close, emaLen)
rng = ta.atr(atrLen)
upper = mid + mult * rng
lower = mid - mult * rng

pU = plot(upper, "Upper", color=#4a3aa7)
pL = plot(lower, "Lower", color=#4a3aa7)
plot(mid, "Middle", color=#eb6834, linewidth=2)
fill(pU, pL, color=color.new(#2a78d6, 92))
ta.ema for the centerline and ta.atr for the width — the modern Keltner from
the output chart. (Pine also has a built-in ta.kc(close, length, mult) if you
prefer the one-call version.)
The squeeze highlighter
// Bollinger inside Keltner = squeeze.
basis = ta.sma(close, 20)
dev = 2 * ta.stdev(close, 20)
bbU = basis + dev
bbL = basis - dev
squeeze = bbU < upper and bbL > lower
bgcolor(squeeze ? color.new(color.gray, 80) : na, title="Squeeze")
When the Bollinger Bands contract inside the Keltner Channels, the background lights up — the low-volatility coil that often precedes a breakout.
Breakout signals and alerts
Turn the channel into tradeable events — a close escaping the band, with an exit back at the centerline:
longBreak  = ta.crossover(close, upper)
shortBreak = ta.crossunder(close, lower)
plotshape(longBreak,  "Break up",   shape.triangleup,   location.belowbar, color=#0ca30c, size=size.tiny)
plotshape(shortBreak, "Break down", shape.triangledown, location.abovebar, color=#d03b3b, size=size.tiny)
alertcondition(longBreak,  "KC break up",   "Close broke above the upper Keltner band")
alertcondition(shortBreak, "KC break down", "Close broke below the lower Keltner band")
Combine these with the squeeze background above and you have a complete “coil, then break” visual: the pane greys out during compression, then a triangle marks the escape.
Gotchas
ta.emacenterline. The modern Keltner uses an EMA;ta.smawould give the older style.ta.stdevfor Bollinger,ta.atrfor Keltner. Two different volatility measures — that difference is exactly what makes the squeeze informative.- Separate ATR/EMA lengths. They’re commonly different (20/10); expose both.
Same indicator elsewhere: Python, MQL5, EasyLanguage, NinjaScript. Then test a squeeze in AlgoGen.
This post is educational, not financial advice. Indicators describe the past; they don’t predict the future. Backtest anything before you risk real money on it.
Sources and further reading
- Pine Script built-ins (TradingView)