Most indicators in this series have a single author and a fixed formula. The Keltner Channel is unusual: the version you use today is not really the one the man it’s named after invented. It’s a two-act story — a 1960 original and a 1980 redesign — and knowing both explains why “Keltner Channel” can mean two different things depending on who you ask.
Act one: Chester Keltner, 1960
The channel is named for Chester W. Keltner (1909–1998), a Chicago grain trader who described the original version in his 1960 book, How To Make Money in Commodities. He didn’t call it the “Keltner Channel” — that name came later from admirers. He called it the Ten-Day Moving Average Trading Rule.
Keltner’s original construction was simple and of its era:
- The centerline was a 10-day simple moving average of the typical price,
(High + Low + Close) / 3. - The bands were set by adding and subtracting a 10-day simple moving average of the high-low range from that centerline.
So the band width was driven by the average daily range — a reasonable, if crude, volatility proxy. It was a sensible, hand-computable rule for a 1960 commodities trader, and it captured the essential idea: a moving average with a range-based envelope around it.
Act two: Linda Raschke, 1980
The version on your screen today largely comes from Linda Bradford Raschke, a well-known trader (profiled among the “Market Wizards”), who modified the Keltner Channel around 1980 into a more robust, volatility-aware tool. Her changes were two-fold and both stuck:
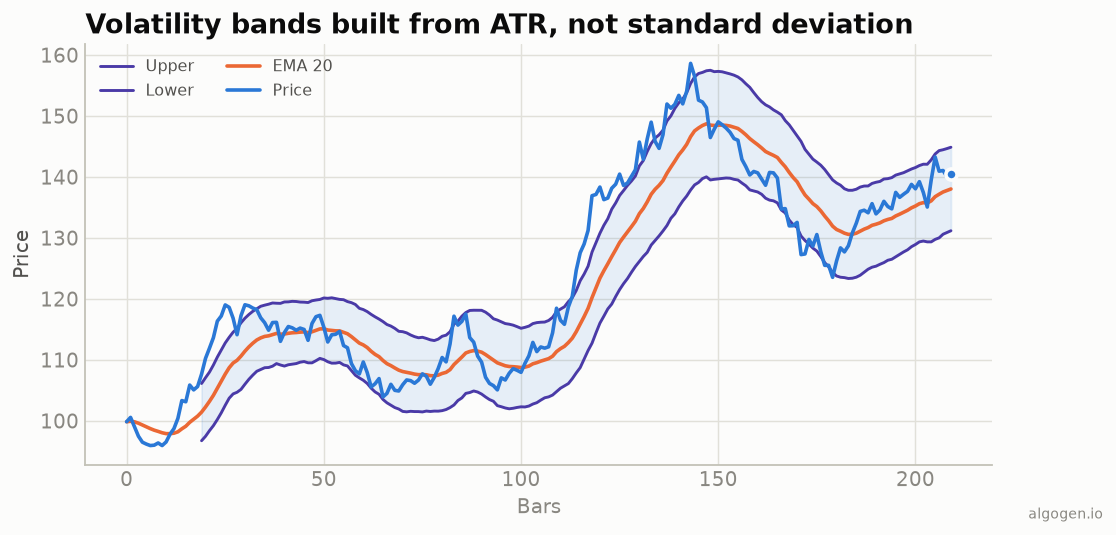
- She swapped the simple moving average centerline for an exponential moving average, making it more responsive.
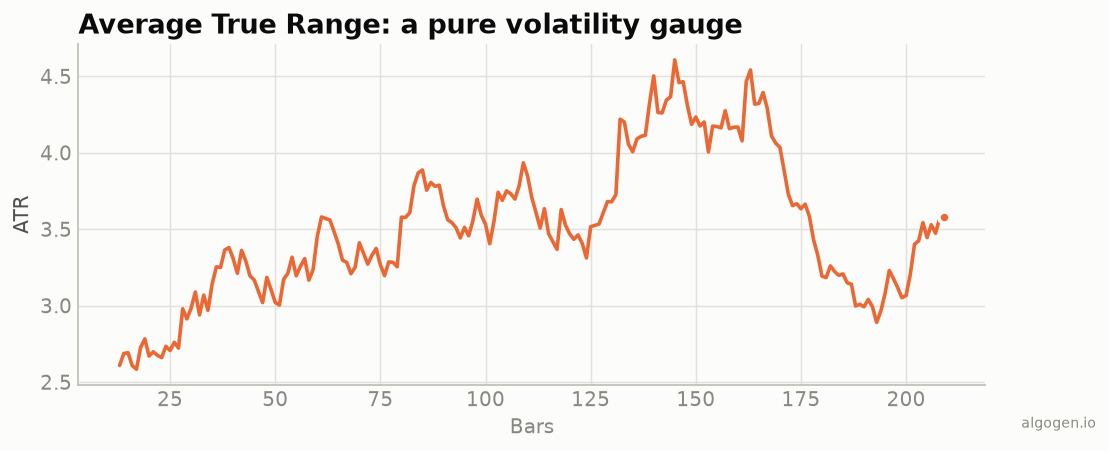
- More importantly, she based the band width on the Average True Range — Wilder’s ATR — rather than the plain high-low range.
Using ATR was a meaningful upgrade because, unlike a simple range average, ATR accounts for gaps (it includes the previous close in its calculation). The result was a channel that measured volatility more honestly, especially in markets prone to gapping. The modern standard — a 20-period EMA with bands at roughly 2 ATRs — descends directly from Raschke’s redesign.
Why the two-version thing matters
This history has a practical consequence: if you compare “Keltner Channels” across two platforms or two books, you might be looking at two genuinely different formulas — the SMA/range original or the EMA/ATR modern version — with different centerlines and different band widths. It’s worth checking which one a given tool implements. In this series, our implementations use the modern EMA/ATR form, because that’s what almost everyone means today.
The squeeze gave it a second life
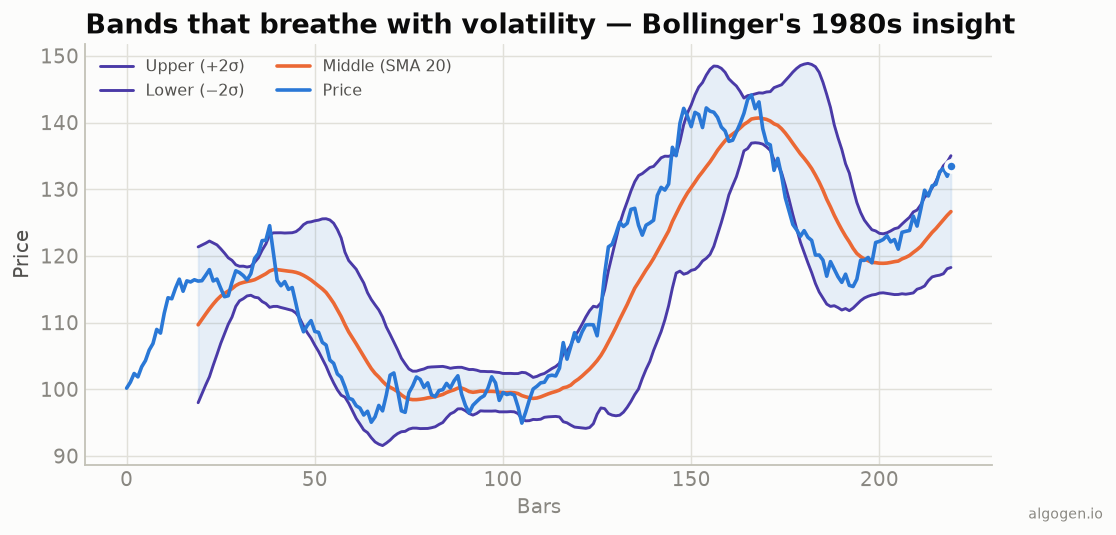
Keltner’s most famous modern application arrived long after both Keltner and Raschke: the squeeze. Trader John Carter popularized comparing Keltner Channels against Bollinger Bands — when the standard- deviation-based Bollinger Bands contract inside the ATR-based Keltner Channels, volatility has compressed unusually, often before a sharp expansion. His “TTM Squeeze” turned this two-indicator comparison into one of the most-watched setups in retail trading. It only works because the two channels measure volatility differently: standard deviation reacts faster than ATR, so their relative width carries information neither could give alone. An indicator from 1960, redesigned in 1980, found a killer app decades later by being paired with a rival — a nice reminder that indicators live in an ecosystem, not in isolation.
Why it endured
The Keltner Channel survived for the same reason as the other classics — it’s simple and cheap to compute — but it got a second wind precisely because it evolved. Raschke’s ATR-based redesign kept it relevant in an era that increasingly thought about volatility formally, and it found a modern killer app in the squeeze: comparing Keltner Channels against Bollinger Bands to spot unusually low volatility, a setup popularized decades after Keltner’s original book. An indicator that could adapt across sixty years is a rare thing.
And, as always, there’s nothing to buy: an EMA, an ATR, and a multiplier. You can build the modern Keltner Channel — and the 1960 original, if you’re curious — in a few lines, which is what we do in the implementation posts.
This post is educational, not financial advice. Indicators describe the past; they don’t predict the future. Backtest anything before you risk real money on it.