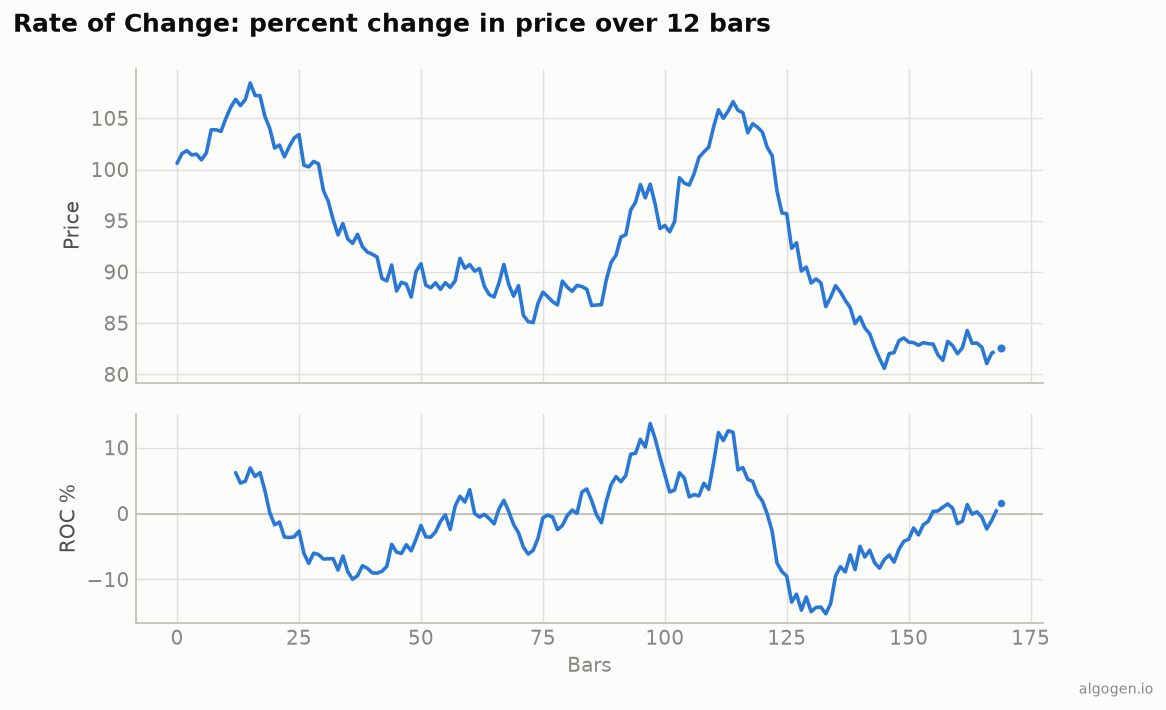
The Rate of Change might be the most honest indicator in this entire series, because it hides nothing. It’s the percent change in price over some number of bars. That’s the whole thing. No smoothing, no bands, no acceleration factor — just “how much has price moved, in percent, over the last N bars.” Let’s do the math, which will take about one line.
The one-sentence job
ROC measures the percentage change in price from N bars ago to now. Positive ROC means price is higher than it was N bars back (upward momentum); negative means lower. The bigger the number, the faster the move.
The formula
With a common period of 12:
ROC = 100 × (Close − Close N bars ago) / (Close N bars ago)
If price was 100 twelve bars ago and is 110 now, ROC = 100 × (110−100)/100 = 10
— price is up 10% over the window. If it’s 95 now, ROC = −5. It oscillates around
a zero line, crossing above zero when price is higher than it was N bars ago and
below when it’s lower.
ROC vs the Momentum indicator
These two are siblings, and the difference is exactly one operation:
- ROC = the percentage change:
100 × (close − close[n]) / close[n]. - Momentum = the absolute change:
close − close[n](or sometimesclose / close[n] × 100).
ROC’s advantage is that percentages are comparable across instruments and across time — 10% means the same thing on a $5 stock and a $500 one, whereas an absolute “10 point” move does not. That comparability is why many people prefer ROC.
How to read it
Zero-line crosses. ROC crossing above zero = price has turned higher than N bars ago (momentum turning up); below zero = turning down. The simplest signal.
Extremes. Unusually high ROC means an unusually fast move — often overextended and prone to a pause or pullback. Unlike the RSI, ROC has no fixed overbought/oversold levels; what counts as “extreme” depends on the instrument, so traders eyeball recent ROC peaks or use standard-deviation bands.
Divergence. Price makes a new high but ROC makes a lower high → the new high had less momentum. Same idea as everywhere else in this series.
Speed and acceleration. Because ROC is speed, watching it rise or fall tells you whether a move is accelerating or decelerating.
The settings
Common periods are 12 and 25; shorter is twitchier, longer is smoother. There’s nothing magic about any value — pick one to suit your timeframe and test it.
Where it lies to you
- Unbounded, no fixed levels. Without natural ceilings, “overbought” is relative and eyeballed. This makes mechanical signals harder than with a bounded oscillator.
- Noisy. With no smoothing, ROC jumps around; many traders smooth it with a short moving average.
- The “N bars ago” reference can distort. A single unusual bar dropping out of the window N bars later can jerk ROC around for reasons unrelated to today’s price (the “drop-off effect”).
- It’s a description, not a prediction. ROC tells you how fast price has moved; extrapolating that forward is your assumption, not the indicator’s.
The Rate of Change is momentum in its purest, most transparent form. It’s a great building block and a clean second opinion on trend strength — just respect that its lack of fixed levels means you supply the context.
It powers bigger indicators
If ROC feels almost too simple to be worth much on its own, remember it’s a building block. The Coppock Curve (a long-term bottom-spotting tool) is a weighted average of two ROCs; Martin Pring’s KST sums four smoothed ROCs; and the MACD is momentum in spirit too. Learning ROC well means you understand the engine inside a whole family of more elaborate oscillators — and you can always smooth or combine ROCs yourself rather than buying the “advanced” version.
Now go test it, don’t trust it
Does an ROC zero-cross, or an ROC-smoothed signal, add anything on your market? That’s a quick backtest. Build it in AlgoGen and see. Then build ROC yourself in Python, MQL5, Pine Script, EasyLanguage, or NinjaScript.
This post is educational, not financial advice. Indicators describe the past; they don’t predict the future. Backtest anything before you risk real money on it.