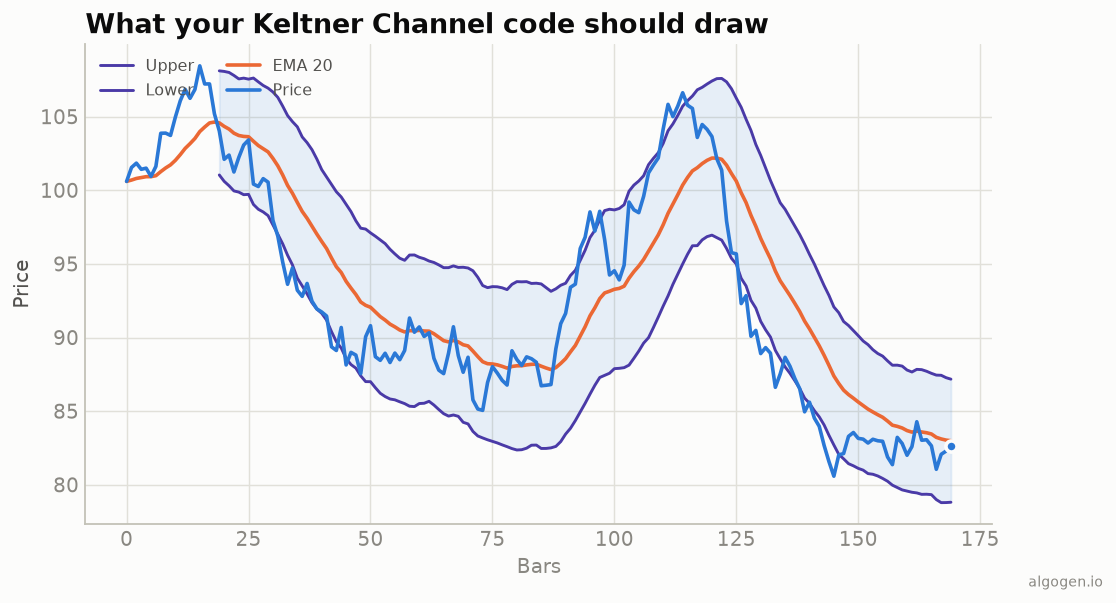
Keltner Channels are two pieces you’ve already built: an EMA centerline and ATR bands. See the explainer for the concept; here’s the Python, plus the squeeze that makes Keltner especially useful.
What you’ll need
- Python 3.9+,
pandas/numpy high,low,closeseries.
From scratch
import pandas as pd


def atr(high, low, close, period=10):
    prev = close.shift(1)
    tr = pd.concat([high - low, (high - prev).abs(), (low - prev).abs()], axis=1).max(axis=1)
    tr.iloc[0] = high.iloc[0] - low.iloc[0]
    return tr.ewm(alpha=1 / period, adjust=False).mean()


def keltner(high, low, close, ema_period=20, atr_period=10, mult=2.0):
    mid = close.ewm(span=ema_period, adjust=False).mean()
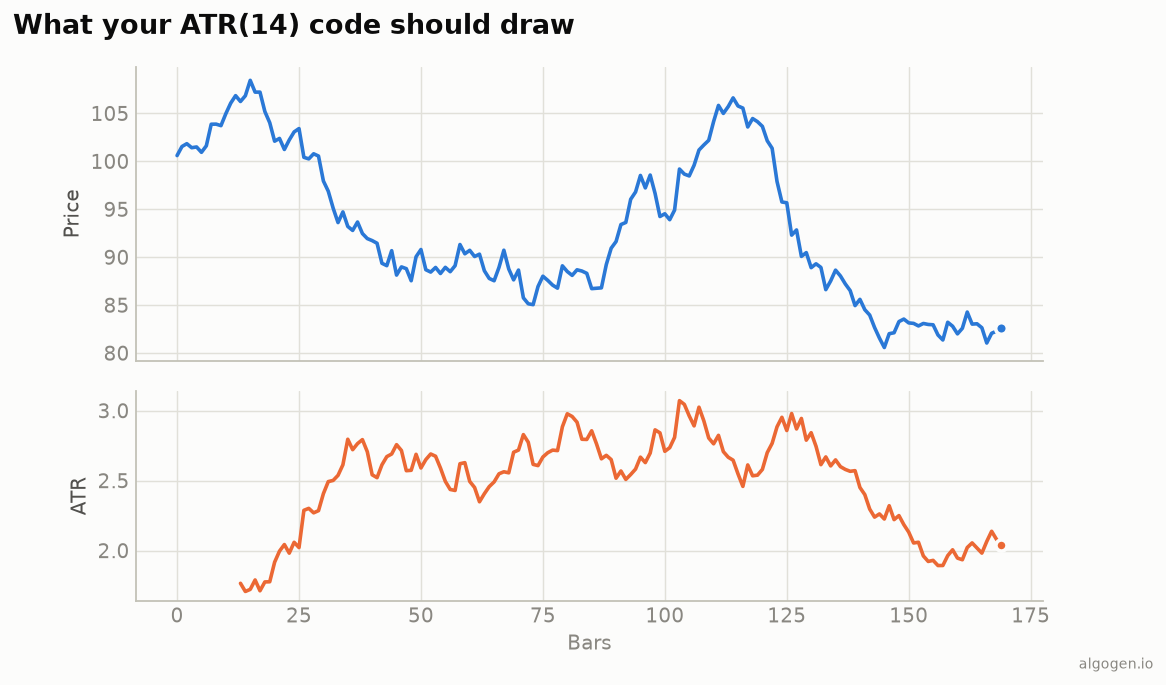
    a = atr(high, low, close, atr_period)
    return pd.DataFrame({"mid": mid, "upper": mid + mult * a, "lower": mid - mult * a})
The centerline is an EMA of close; the bands are the EMA plus and minus a multiple of ATR. That’s the whole channel from the output chart.
The squeeze: Bollinger inside Keltner
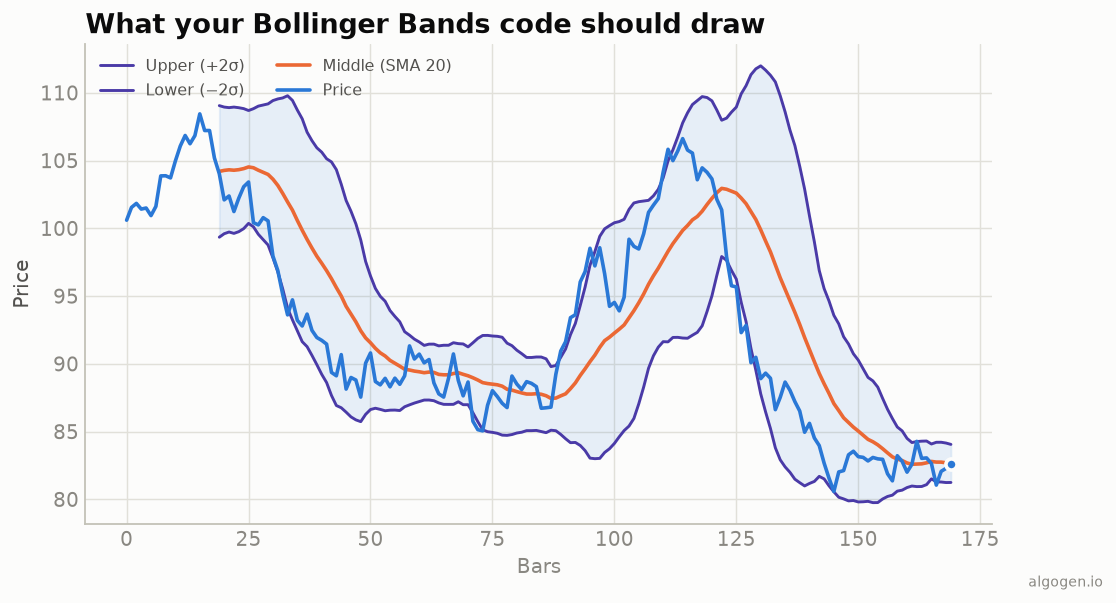
Keltner’s standout use is spotting low-volatility coils by comparing it to Bollinger Bands:
kc = keltner(df["high"], df["low"], df["close"])
mid = df["close"].rolling(20).mean()
sd = df["close"].rolling(20).std(ddof=0)
bb_upper, bb_lower = mid + 2 * sd, mid - 2 * sd

# Squeeze: Bollinger Bands sit INSIDE the Keltner Channels.
df["squeeze"] = (bb_upper < kc["upper"]) & (bb_lower > kc["lower"])
When squeeze is True, volatility is compressed and a breakout often follows —
a setup to test in AlgoGen.
Gotchas
- EMA centerline, not SMA. The modern Keltner uses an EMA; using an SMA gives the older variant (and won’t match most platforms).
- ATR period vs EMA period. They’re often different (e.g. 20 EMA, 10 ATR). Keep them as separate parameters.
- Squeeze uses population std for Bollinger (
ddof=0) — the same gotcha as always.
Breakout signals
Beyond the squeeze, the channel itself gives breakout and pullback signals:
kc = keltner(df["high"], df["low"], df["close"])
close = df["close"]
df["break_up"]   = (close > kc["upper"]) & (close.shift(1) <= kc["upper"].shift(1))
df["break_down"] = (close < kc["lower"]) & (close.shift(1) >= kc["lower"].shift(1))
# Exit a long when price falls back through the EMA centerline:
df["long_exit"]  = (close < kc["mid"]) & (close.shift(1) >= kc["mid"].shift(1))
A common combination is to only act on break_up when the previous bar was in a
squeeze — the coil-then-break pattern — which you can backtest in
AlgoGen.
The lazy one-liner
import pandas_ta as ta
df.ta.kc(length=20, scalar=2, append=True)   # adds KCL/KCB/KCU columns
Same indicator elsewhere: MQL5, Pine Script, EasyLanguage, NinjaScript.
This post is educational, not financial advice. Indicators describe the past; they don’t predict the future. Backtest anything before you risk real money on it.
Sources and further reading
- Windowing operations (pandas documentation)