Don’t let the name fool you. The Commodity Channel Index was built for commodities, but it works on stocks, currencies, crypto — anything with a price. Underneath the slightly intimidating formula, it’s answering a simple question: how unusual is today’s price compared to its recent average? Let’s do the math.
The one-sentence job
CCI measures how far the current price has strayed from its average, expressed in units of the price’s own typical deviation. A CCI of +100 means price is stretched notably above average; −100, notably below; near 0, right around average.
The formula
Three ingredients, with a default period of 20:
Typical Price (TP) = (High + Low + Close) / 3
CCI = (TP − SMA(TP)) / (0.015 × Mean Absolute Deviation)
Walking through it:
- Typical Price is the bar’s center of gravity,
(H+L+C)/3. - SMA(TP) is the simple moving average of typical price — the “normal” level.
- Mean Absolute Deviation (MAD) is the average distance of TP from its own SMA over the window. Note: this is mean absolute deviation, not the standard deviation used by Bollinger Bands — a common point of confusion.
- 0.015 is a scaling constant Lambert chose deliberately (more on that below).
So CCI is “distance of price from its average” divided by “typical distance of price from its average,” scaled. When price is a typical distance from the mean, CCI is around ±100; when it’s way out of the ordinary, CCI runs far beyond.
Why 0.015?
That magic constant isn’t arbitrary. Lambert picked 0.015 so that roughly 70–80% of CCI values fall between −100 and +100. It calibrates the indicator so the ±100 levels are meaningfully “unusual” without being so extreme they never trigger. It’s a nice bit of statistical tuning baked right into the formula.
How to read it (two schools)
CCI is unusual in that it supports two almost-opposite interpretations, and which one you use matters enormously:
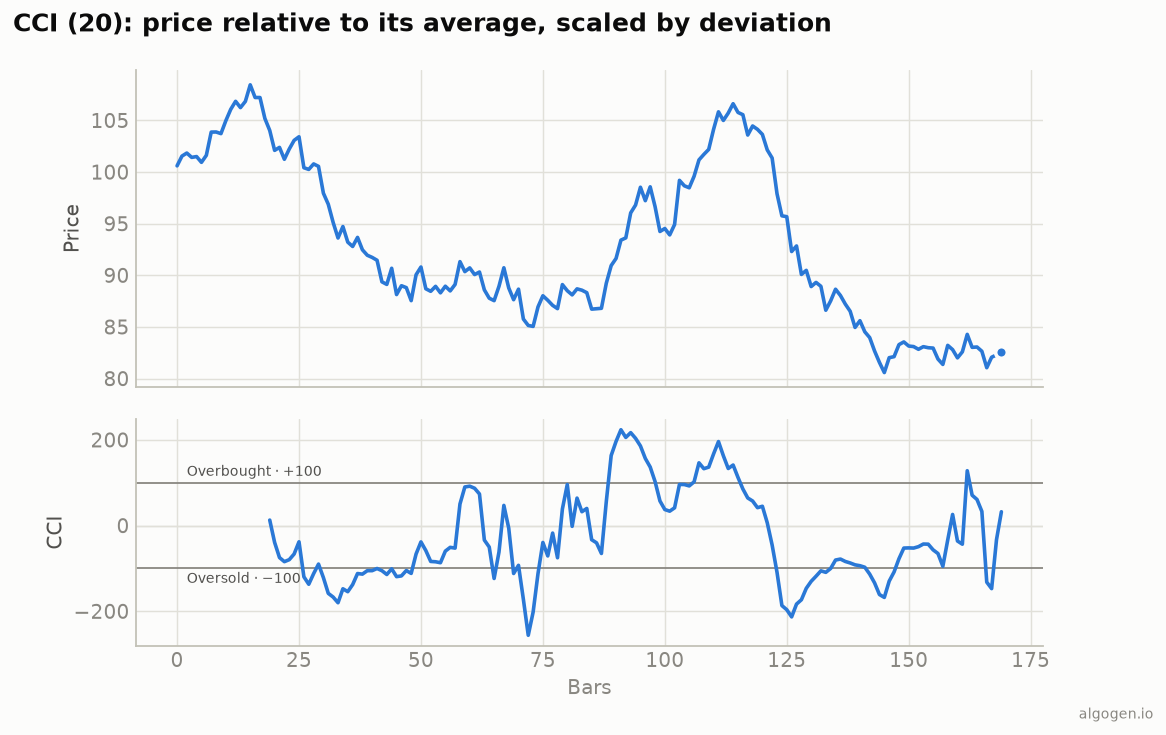
As a reversal / overbought-oversold tool: treat above +100 as overbought and below −100 as oversold, fading the extremes back toward zero. Works best in ranging markets.
As a breakout / trend tool: treat a move above +100 as the start of a strong up-move (momentum breaking out), going with it rather than fading it. Lambert himself leaned toward this breakout reading. Works best in trending markets.
Same indicator, opposite trades — which is why blindly copying “sell at +100” gets people hurt. Other reads: zero-line crosses (CCI crossing up through 0 = momentum turning positive) and divergence versus price, same idea as elsewhere.
Unbounded, unlike the RSI
A key difference from the RSI and stochastic: CCI is not bounded. There’s no ceiling at +100; a violent move can push it to +200, +300 or beyond. The ±100 lines are reference levels, not limits. On the chart above, watch CCI punch well past ±100 during strong swings.
The settings
Default 20; 14 is also common. Shorter periods make it twitchier and push it past ±100 more often; longer periods calm it. As always, treat these as starting points and test rather than trust.
Where it lies to you
- The dual interpretation. Reversal vs breakout are opposite trades. You must decide which regime you’re in (an ADX filter helps) before acting on ±100.
- Unbounded means no natural ceiling. “Overbought at +100” can keep going to +300 in a strong trend — fading it is dangerous.
- MAD ≠ standard deviation. If you compute it with standard deviation, your CCI won’t match anyone else’s. Use mean absolute deviation.
- Noisy at short periods. Small lookbacks whip across ±100 constantly.
CCI is a flexible, well-calibrated “how far from normal is price?” gauge. Its flexibility is also its trap: decide up front whether you’re fading extremes or riding breakouts, because the indicator happily supports both and punishes indecision.
Now go test it, don’t trust it
Reversal or breakout — which actually works for CCI on your market? That’s a clean backtest. Try both in AlgoGen and let the equity curves settle the argument. Then build CCI yourself in Python, MQL5, Pine Script, EasyLanguage, or NinjaScript.
This post is educational, not financial advice. Indicators describe the past; they don’t predict the future. Backtest anything before you risk real money on it.