Pine has ta.cci built in, and — handily — it also has ta.dev, which is exactly
the mean absolute deviation the CCI needs. That makes the from-scratch version a
clean one-to-one match with the explainer’s formula.
What you’ll need
- A TradingView account (free tier is fine)
- The Pine Editor
The source
//@version=5
indicator("AlgoGen CCI", shorttitle="AG CCI", overlay=false)

length = input.int(20, "Length", minval=1)
cciVal = ta.cci(close, length)   // uses hlc3 typical price internally

plot(cciVal, "CCI", color=#2a78d6, linewidth=2)
hline(100,  "Overbought", color=color.gray)
hline(-100, "Oversold",   color=color.gray)
hline(0, "Zero", color=color.new(color.gray, 60))
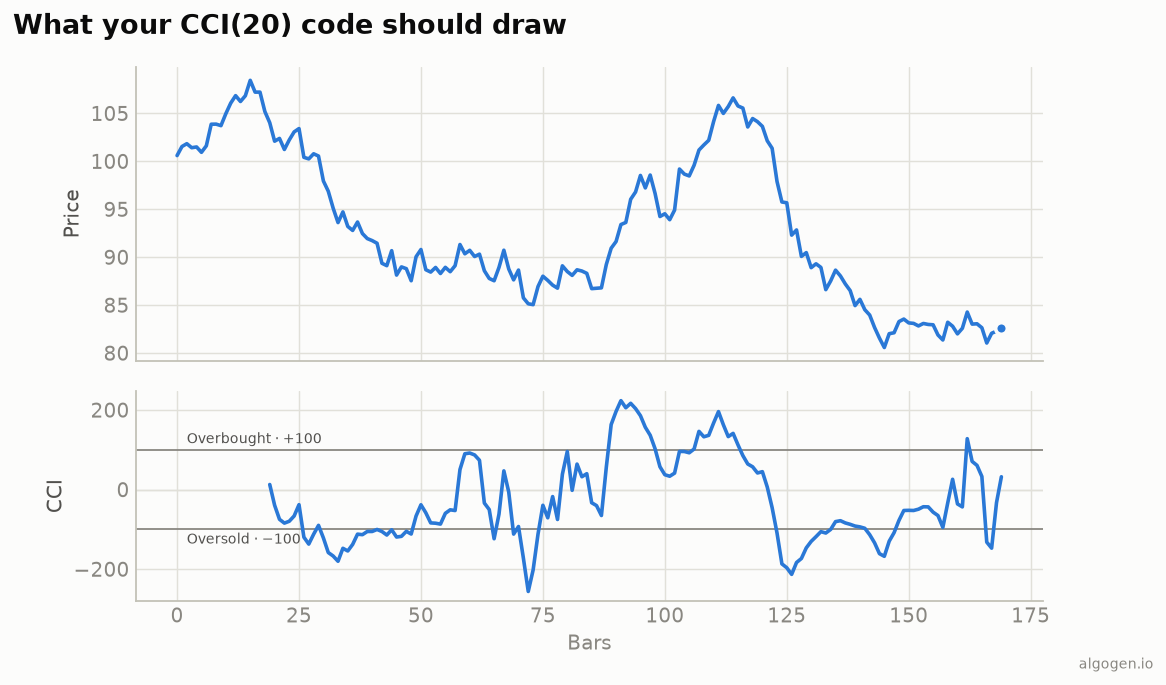
ta.cci(close, length) computes the standard CCI using the typical price
internally, giving the blue line and ±100 references from the output chart.
From scratch, with ta.dev
To prove the mean-absolute-deviation denominator:
//@version=5
indicator("AlgoGen CCI (manual)", overlay=false)
length = input.int(20, "Length")
tp = hlc3                                   // (high + low + close) / 3
ma = ta.sma(tp, length)
mad = ta.dev(tp, length)                    // ta.dev == mean absolute deviation
cciManual = (tp - ma) / (0.015 * mad)
plot(cciManual, color=#2a78d6, linewidth=2)
ta.dev is the key: it returns the mean absolute deviation, not the standard
deviation (ta.stdev). Swap those two and your CCI silently breaks.
Breakout vs reversal signals
Because CCI supports two opposite strategies, make the choice explicit in code and alert on it:
// Breakout reading (Lambert's lean): momentum pushing out past +100/-100.
breakoutUp = ta.crossover(cciVal, 100)
breakoutDn = ta.crossunder(cciVal, -100)
// Reversal reading: snapping back in from an extreme.
reclaimUp  = ta.crossover(cciVal, -100)
reclaimDn  = ta.crossunder(cciVal, 100)

plotshape(breakoutUp, "Breakout up", shape.triangleup, location.bottom, color=#0ca30c, size=size.tiny)
alertcondition(breakoutUp, "CCI breakout up", "CCI crossed above +100")
alertcondition(reclaimUp,  "CCI reclaim up",  "CCI crossed back above -100")
Plot whichever matches your regime — riding breakoutUp in trends, fading via
reclaimUp in ranges. They fire at very different moments.
Gotchas
ta.dev, notta.stdev. Mean absolute deviation is the correct denominator;ta.stdev(used by Bollinger Bands) is a different quantity.hlc3is the typical price. Pine’shlc3is(high+low+close)/3, exactly what CCI expects.- Unbounded pane. Let TradingView auto-scale; CCI regularly exceeds ±100 and clamping it would hide the signal.
Same indicator elsewhere: Python, MQL5, EasyLanguage, NinjaScript. Then test a CCI strategy in AlgoGen.
This post is educational, not financial advice. Indicators describe the past; they don’t predict the future. Backtest anything before you risk real money on it.
Sources and further reading
- Pine Script built-ins (TradingView)