Plenty of fancy-sounding “trend detection systems” are, once you look under the hood, a simple moving average. You can build the exact same thing with addition and division — the two operations you learned before you could ride a bike. Let’s do the math and keep it simple.
The one-sentence job of the Simple Moving Average: take the last N closing prices, add them up, divide by N, and plot that number. Do it again next bar. As each new bar arrives, the oldest price drops out of the window and the newest drops in — the average moves. That’s the entire idea, and it’s why it’s called a moving average. Nothing is hidden.
The formula
SMA(N) at this bar = (P₁ + P₂ + … + P_N) / N
where P₁ … P_N are the last N closing prices. For a 20-bar SMA you’re averaging
the last 20 closes; next bar, you average the newest 20. Every price in the
window counts equally — the close from 20 bars ago pulls on the average exactly
as hard as yesterday’s close. Hold onto that “equal weight” idea, because it’s
the single most important thing about the SMA and the reason the EMA exists.
What it actually does: it lags, on purpose
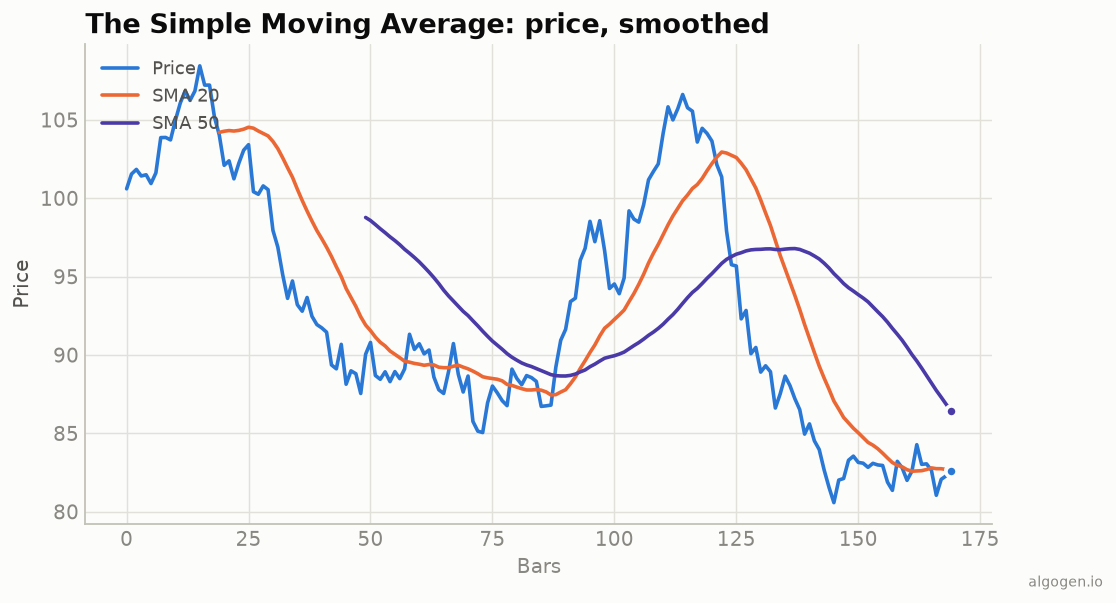
A moving average is a smoother. Price is a jittery, noisy line; the SMA is a calmer line that follows underneath it, filtering out the wiggle so you can see the trend. But smoothing has a price, and that price is lag. Because the SMA is looking backward at N bars, it always reacts after price turns. The bigger the window, the smoother the line — and the more it lags.
Look at the chart above: the 20-bar SMA (orange) hugs price fairly closely and turns quickly. The 50-bar SMA (violet) is smoother and slower, turning well after price has already changed direction. That trade-off — smoothness versus responsiveness — is the only real decision you make with a moving average.
How to read it
Direction and slope. The simplest read: price above a rising SMA is an uptrend; price below a falling SMA is a downtrend. The slope matters as much as the crossing.
Dynamic support and resistance. In a healthy trend, price often pulls back to a moving average and bounces. Traders watch the 50-day and 200-day as “areas” where a trend might resume. It’s not magic — it’s partly self-fulfilling, because so many people watch the same lines.
Crossovers. When a faster SMA crosses above a slower one, it’s a golden cross (momentum turning up); the reverse is a death cross. The chart marks both: the green ▲ where the 20 crosses up through the 50, the red ▼ where it crosses back down. Crossover systems are the oldest mechanical trading rules there are — and, importantly, they are trivially backtestable, which is exactly what you should do before trusting one.
The famous periods
- 20 — roughly a trading month; a common short-term trend line.
- 50 — the medium-term trend everyone quotes.
- 200 — the big one. “Above the 200-day” versus “below the 200-day” is practically financial-media shorthand for bull versus bear. It’s not sacred, but its cultural gravity is real.
None of these are laws. They’re conventions with momentum behind them. Pick periods that suit your timeframe, then — say it with me — test whether they made money.
Where it lies to you
- Lag at turns. The SMA is always late to a reversal. In a fast V-shaped bottom it will have you selling near the low and buying back higher.
- Whipsaws in chop. In a sideways, trendless market, price crosses back and forth over the average constantly, and a crossover system gets chopped to pieces paying commissions on every fake-out.
- Equal weighting feels wrong to some. Why should a price from 200 bars ago matter as much as today’s? If that bothers you, you’ve just discovered the motivation for the Exponential Moving Average, which weights recent prices more heavily.
The SMA isn’t trying to predict anything. It’s a clean, honest summary of where price has been. Used as a context tool — “which side of the trend are we on?” — it’s one of the most useful lines you can draw. Used as a magic buy/sell signal with no testing, it’s a great way to donate money to the market.
Now go test it, don’t trust it
You now understand the SMA completely, which means you never need to buy one. The real work is finding out whether an SMA rule beats simply holding the asset, after costs and slippage. Drop a crossover rule into AlgoGen, run it across real history, and read the equity curve. Then build the line yourself — it’s a couple of lines of code — in Python, MQL5, Pine Script, EasyLanguage, or NinjaScript.
This post is educational, not financial advice. Indicators describe the past; they don’t predict the future. Backtest anything before you risk real money on it.
Sources and further reading
- Gartley and the early use of moving averages (CMT Association)