“Stochastic Oscillator” is a spectacularly intimidating name for a very simple question. Strip away the syllables and it asks: when the market closed today, was that near the top of its recent range, or near the bottom? That’s it. The scary name hides a simple idea — let’s do the math.
The one-sentence job
The Stochastic Oscillator measures where the current close sits within the high-to-low range of the last N bars, on a 0–100 scale. Close near the top of the recent range and it reads near 100; close near the bottom and it reads near 0. The premise, from its creator George Lane, is intuitive: in an uptrend, prices tend to close near their highs; when that stops happening, momentum may be fading.
The formula
The core line is %K, and the default lookback is 14:
%K = 100 × (Close − Lowest Low over N) / (Highest High over N − Lowest Low over N)
- Lowest Low / Highest High over N are the lowest low and highest high of the last N bars.
- If the close equals the highest high of the range, %K = 100. If it equals the lowest low, %K = 0. Everywhere else, it’s proportional.
Then there’s %D, the signal line:
%D = 3-period simple moving average of %K
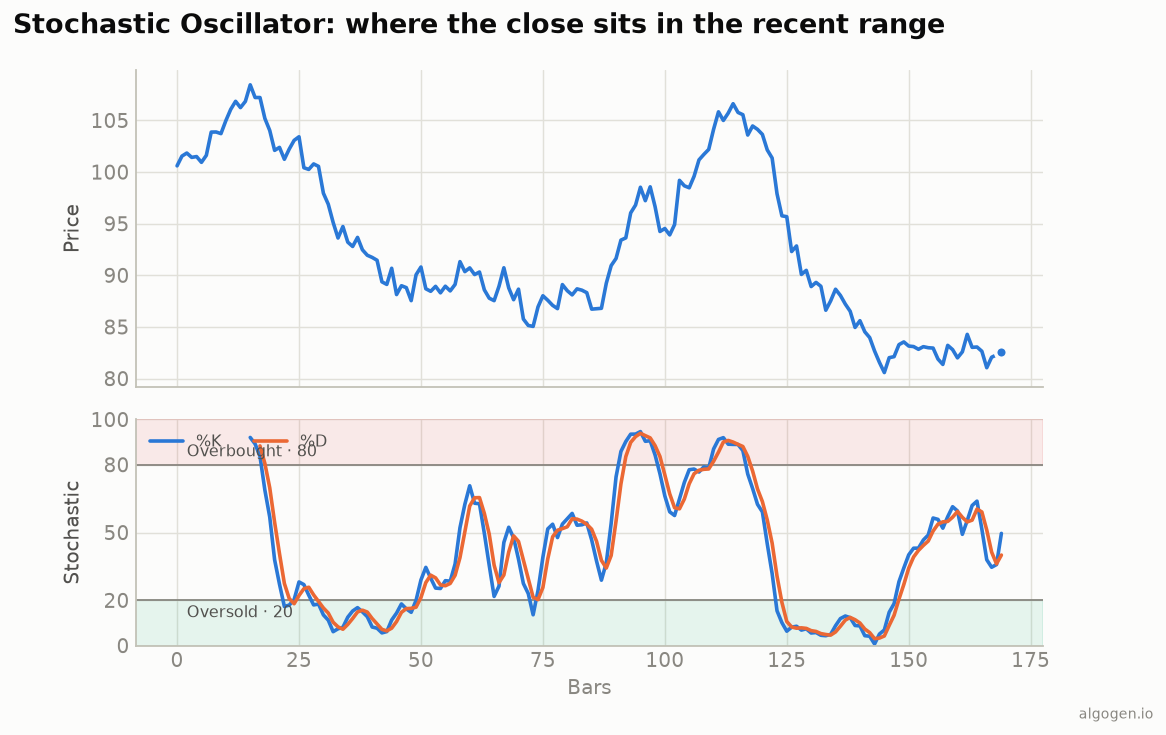
That’s the fast stochastic. In practice most people use the slow stochastic, which smooths %K once before taking %D — it’s less jumpy and the default you’ll see quoted as 14, 3, 3. On the chart above, %K is the blue line and %D the orange one; %D lags because it’s an average of %K.
How to read it
80/20 levels. Above 80 is “overbought” (closes clustering near the top of the range); below 20 is “oversold.” As with the RSI, read these as conditions, not commands — in a strong trend the stochastic can pin itself above 80 for a long time.
%K/%D crosses. The most-traded stochastic signal: %K crossing above %D (especially from oversold) is a bullish trigger; %K crossing below %D (from overbought) is bearish. These are the points where the blue line cuts through the orange one.
Divergence. Lane himself considered divergence the most important stochastic signal. If price makes a higher high but the stochastic makes a lower high, the new high closed less convincingly within its range — a momentum warning.
Fast vs slow (and settings)
- Fast stochastic (e.g. 14, 3): raw %K plus its 3-period %D. Responsive but noisy.
- Slow stochastic (14, 3, 3): %K is smoothed once, then %D smooths again. Calmer, fewer false crosses — the popular default.
Shorten the lookback for a twitchier oscillator, lengthen it to calm it down. It’s a starting point, not scripture — test before you trust.
Where it lies to you
- It pins in trends. Like every bounded oscillator, it can sit overbought or oversold for the entire duration of a strong trend, punishing anyone who fades the first extreme.
- Whipsaws in chop. In a flat market %K and %D tangle and every cross is noise.
- Range dependence. Because it’s defined by the recent high-low range, a single spike high or low can distort the range and the reading for N bars.
- Divide-by-zero. If the range is perfectly flat (highest high = lowest low), the formula divides by zero — a real edge case to handle in code.
The Stochastic Oscillator is, underneath the name, a clean read on closing strength relative to the recent range. Used for crosses and divergence with awareness of the trend, it’s genuinely useful. Used as a blind “over 80, sell” buzzer, it will happily separate you from your money.
Now go test it, don’t trust it
You now understand every line on that chart. The move is to test whether a stochastic rule beats simply holding, after costs. Drop a %K/%D cross into AlgoGen and read the equity curve. Then build it yourself in Python, MQL5, Pine Script, EasyLanguage, or NinjaScript.
This post is educational, not financial advice. Indicators describe the past; they don’t predict the future. Backtest anything before you risk real money on it.
Sources and further reading
- The Origins of the Stochastic Oscillator (CMT Association)