If you’ve read the stochastic post, you already understand 90% of Williams %R — because it asks the exact same question, just flipped upside down. Both measure where the current close sits within the recent high-low range. The stochastic scales it 0 to 100; Williams %R scales it 0 to −100. Same idea, mirror image. Let’s do the math.
The one-sentence job
Williams %R measures how far below the recent high the current close is, as a percentage of the recent range, on a −100 to 0 scale. Close near the top of the range reads near 0; close near the bottom reads near −100.
The formula
With a default lookback of 14:
%R = (Highest High − Close) / (Highest High − Lowest Low) × −100
- If the close equals the highest high of the range, the numerator is 0, so %R = 0 (the top).
- If the close equals the lowest low, numerator equals denominator, so %R = −100 (the bottom).
That leading minus sign is the whole reason %R lives in negative territory. Some platforms quietly flip it to a 0-to-100 scale, but the classic, as Larry Williams defined it, runs 0 (top) down to −100 (bottom).
It’s basically an inverted fast stochastic
Here’s the honest truth that saves you a lot of confusion: Williams %R is the
fast stochastic %K, inverted and unsmoothed. Where fast %K = (Close − Lowest Low) / (Highest High − Lowest Low) × 100, Williams %R measures the distance from
the top instead of the bottom and multiplies by −100. Numerically, %R ≈ %K − 100. They’re the same information wearing different clothes. If you understand one,
you understand both.
How to read it
Overbought / oversold. The traditional levels, set by Williams himself:
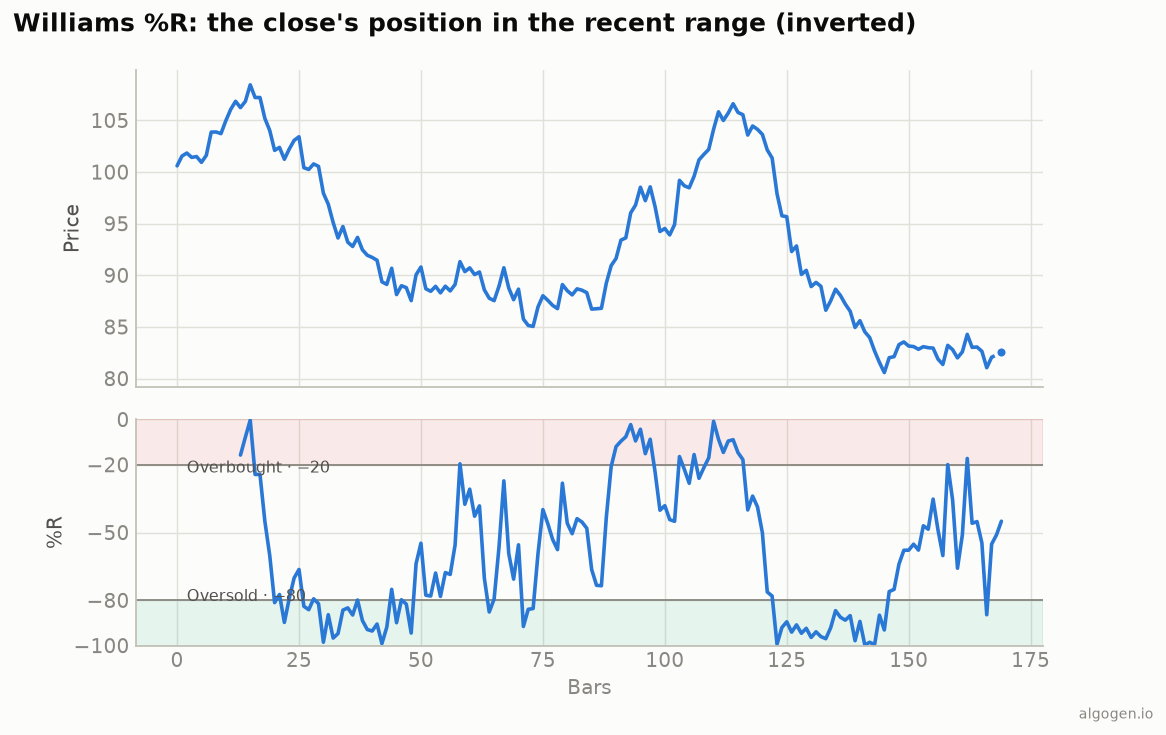
- 0 to −20 → overbought (closes hugging the top of the range).
- −80 to −100 → oversold (closes hugging the bottom).
On the chart above, the top band (near 0) is overbought and the bottom band (near −100) is oversold. Note the counterintuitive geometry: high on the chart = strong = overbought, low on the chart = weak = oversold, same as any oscillator, just with negative numbers.
Failure swings and momentum. Because %R reacts quickly (it’s unsmoothed), some traders use it to spot momentum shifts — for instance, %R pushing to −20 and then failing to get back there on the next rally hints at fading strength.
As a trend filter. In strong trends %R pins near an extreme; some treat “%R holding above −50” as an up-momentum regime and below −50 as down.
The settings
Default 14, same heritage as the other Wilder-era oscillators. Shorten for more sensitivity, lengthen to smooth. Because %R has no built-in smoothing (unlike the slow stochastic), it’s inherently jumpier — many traders add a short moving average of %R to calm it down. As always, test rather than trust.
Where it lies to you
- It pins in trends. Like every range oscillator, %R can sit at −100 or 0 for the entire length of a strong trend. “Oversold” in a downtrend is not a buy signal.
- It’s noisy. No smoothing means more false pokes into the extremes than a slow stochastic.
- Range distortion. A single spike high or low widens the range and skews %R for the whole lookback window.
- The sign trips people up. −80 is “more extreme low” than −20; the negative scale confuses newcomers constantly.
Williams %R is a fast, honest read on closing strength within the recent range. If you already use the stochastic, %R offers nothing radically new — but its speed and simplicity make it a favorite for traders who want an unsmoothed momentum poke.
%R or the stochastic — which?
Practically, it comes down to habit and smoothing. The slow stochastic has built-in smoothing and a signal line (%D), so it gives calmer, crossover-style signals. Williams %R is raw and fast, better when you want an immediate, unsmoothed read on where the close sits — and you can always add your own moving average if you want it calmer. There’s no need to run both; they’re the same measurement. Pick the presentation you find easier to read and move on.
Now go test it, don’t trust it
Does a %R rule — say, exiting oversold in an uptrend — actually help on your market? Build it in AlgoGen and check the equity curve. Then build %R yourself in Python, MQL5, Pine Script, EasyLanguage, or NinjaScript.
This post is educational, not financial advice. Indicators describe the past; they don’t predict the future. Backtest anything before you risk real money on it.
Sources and further reading
- Larry Williams' indicator chronology (I Really Trade)