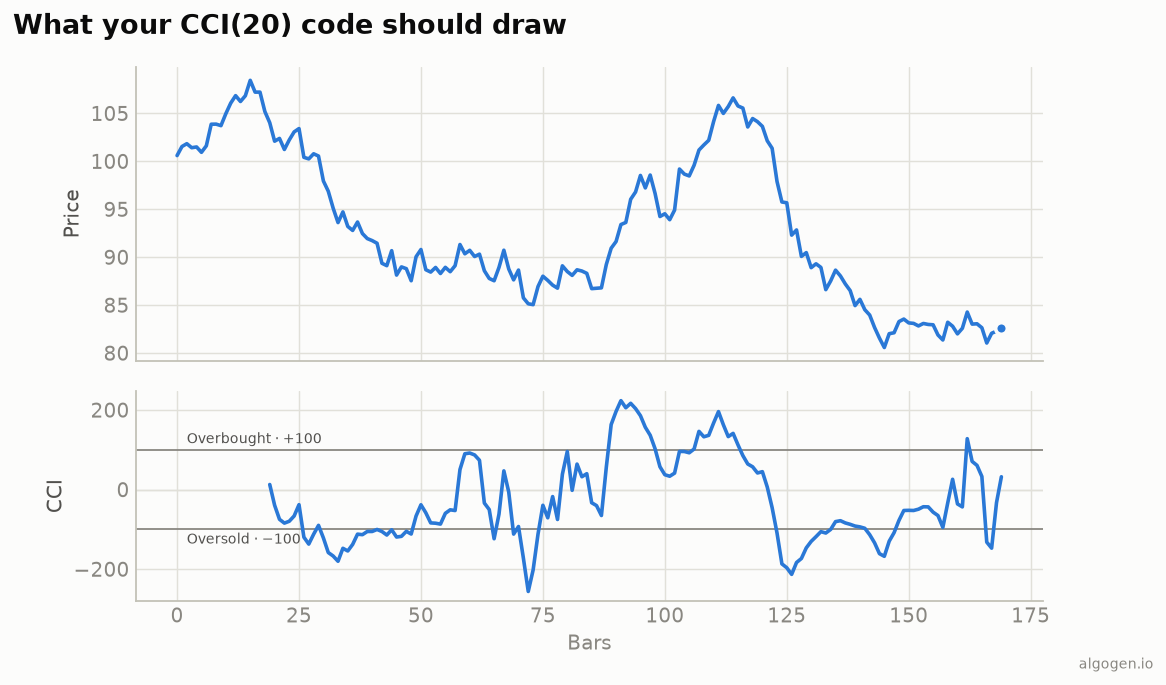
EasyLanguage has CCI built in, which is convenient given it was born in a commodities-trading magazine and TradeStation grew up serving futures traders. See the explainer for the concept.
What you’ll need
- TradeStation or MultiCharts
- The EasyLanguage / PowerLanguage Editor, new Indicator
The built-in version
{ AlgoGen CCI — TradeStation / MultiCharts }
inputs:
    Length( 20 );

variables:
    CCIval( 0 );

CCIval = CCI( Length );

Plot1( CCIval, "CCI" );
Plot2( 100, "OB" );
Plot3( -100, "OS" );
Plot4( 0, "Zero" );
CCI( Length ) returns the standard Commodity Channel Index using typical price —
the blue line with ±100 references from the output chart.
From scratch
To make the mean-absolute-deviation step explicit:
{ AlgoGen CCI (manual) }
inputs: Length( 20 ), Constant( 0.015 );
variables: TP( 0 ), MA( 0 ), MAD( 0 ), jj( 0 ), CCIval( 0 );

TP = ( High + Low + Close ) / 3;
MA = Average( TP, Length );

MAD = 0;
for jj = 0 to Length - 1 begin
    MAD = MAD + AbsValue( TP[jj] - MA );
end;
MAD = MAD / Length;

if MAD = 0 then
    CCIval = 0
else
    CCIval = ( TP - MA ) / ( Constant * MAD );

Plot1( CCIval, "CCI" );
The for loop accumulates the absolute deviations of typical price from its
average — the mean absolute deviation Lambert specified. Note it uses TP[jj], the
typical price jj bars ago.
A regime-aware strategy
CCI’s two readings call for a regime switch. Here’s a breakout version for trending markets:
{ AlgoGen CCI Breakout — Strategy }
inputs: Length( 20 );
variables: CCIval( 0 );
CCIval = CCI( Length );

{ Lambert's breakout reading: enter with the push past the extreme }
if CCIval crosses over 100 then Buy next bar at market;
if CCIval crosses under -100 then SellShort next bar at market;
{ Exit when momentum returns to neutral }
if MarketPosition = 1 and CCIval crosses under 0 then Sell next bar at market;
if MarketPosition = -1 and CCIval crosses over 0 then BuyToCover next bar at market;
Swap the entries for crosses over -100 / crosses under 100 to test the
mean-reversion reading instead, and let the Strategy Performance Report say which
suits your market.
Gotchas
- Mean absolute deviation. The manual loop uses
AbsValue, not squares — EasyLanguage hasStandardDev, but that’s the wrong denominator for CCI. Averageof typical price, not close, feeds both the numerator and the deviation.MAD = 0guard. A flat window would divide by zero; return 0 instead.
Same indicator elsewhere: Python, MQL5, Pine Script, NinjaScript. Then backtest it in AlgoGen.
This post is educational, not financial advice. Indicators describe the past; they don’t predict the future. Backtest anything before you risk real money on it.
Sources and further reading
- What is EasyLanguage? (TradeStation)