Here’s a question most indicators can’t answer: is this market even trending, or am I about to get chopped to pieces? That question matters enormously, because trend-following tools make money in trends and lose it in ranges. The ADX exists to answer exactly that — and it’s one of the most useful “meta” indicators you can own. It has a reputation for being complicated. It’s really just a chain of simple steps. Let’s do the math.
The one-sentence job
ADX measures the strength of a trend on a 0–100 scale, regardless of direction. A high ADX means “strong trend, up or down”; a low ADX means “no trend, price is drifting.” Direction comes from its two companion lines, +DI and −DI.
The pieces (there are three layers)
Ignore the acronyms for a second and follow the logic. Defaults are 14.
1. Directional Movement (+DM, −DM). Compare each bar’s move to the last:
- If today’s high exceeds yesterday’s high by more than today’s low undercuts yesterday’s low, that’s positive directional movement (+DM).
- If the reverse, it’s negative directional movement (−DM).
- The smaller of the two is set to zero — only the dominant direction counts.
2. Directional Indicators (+DI, −DI). Smooth +DM and −DM (Wilder’s smoothing), divide each by the Average True Range, and scale to 100:
+DI = 100 × smoothed(+DM) / ATR
−DI = 100 × smoothed(−DM) / ATR
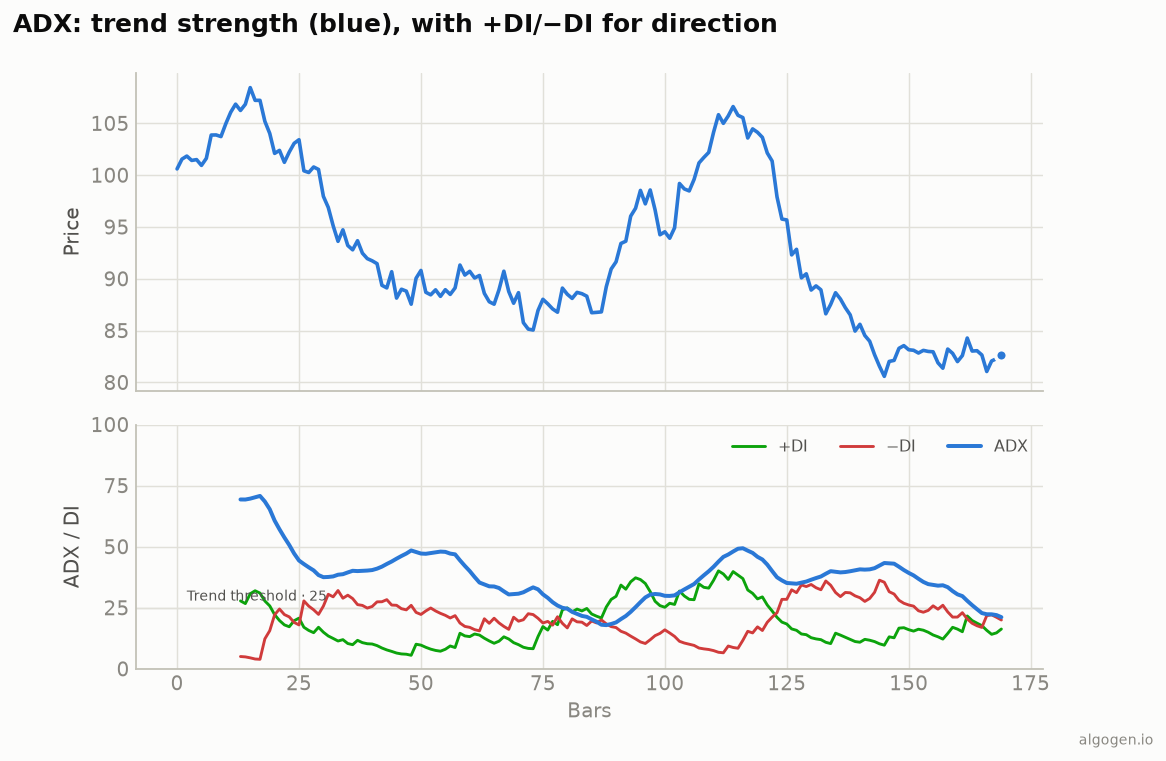
Dividing by ATR normalizes for volatility so you can compare across instruments. On the chart, +DI is green and −DI is red.
3. DX, then ADX. The Directional Index measures how separated the two DIs are:
DX  = 100 × |+DI − −DI| / (+DI + −DI)
ADX = Wilder-smoothed average of DX
When one DI dominates the other (strong directional move), DX is high; when they’re tangled (no clear direction), DX is low. ADX just smooths DX into the stable blue line you actually read.
How to read it
ADX level = trend strength:
- Below 20 → weak or no trend; ranging. Trend-following signals are unreliable here; mean-reversion tools may work better.
- Above 25 → a trend is present and worth following.
- Rising ADX → the trend (whichever direction) is strengthening.
- Falling ADX → the trend is fading, even if price is still moving.
Crucially, ADX says nothing about direction. An ADX of 40 can mean a powerful uptrend or a brutal crash. That’s what +DI/−DI are for.
+DI / −DI = direction:
- +DI above −DI → buyers in control (uptrend).
- −DI above +DI → sellers in control (downtrend).
- DI crossovers are sometimes traded as entry signals, ideally filtered by ADX being above 25 so you’re only acting when a trend actually exists.
The classic combined read: +DI above −DI and ADX above 25 and rising = a strong, tradeable uptrend.
The settings
Wilder’s default is 14, with 25 the traditional “trending” threshold (some use 20). Because ADX is smoothed twice (DI smoothing, then DX smoothing), it’s inherently laggy — that’s the price of its stability.
Where it lies to you
- It lags — a lot. Double smoothing makes ADX slow to react; by the time it confirms a strong trend, a chunk of the move may be done.
- It’s a strength meter, not a timing tool. ADX is best as a filter (“only take trend trades when ADX > 25”), not a standalone entry trigger.
- DI whipsaws. In choppy markets +DI and −DI cross back and forth constantly; trading every cross without the ADX filter is painful.
The ADX’s real gift is regime awareness. Knowing whether you’re in a trend or a range tells you which of your tools to trust — and that meta-knowledge is often worth more than any single entry signal.
Now go test it, don’t trust it
Does filtering your trend signals with “ADX above 25” actually improve results? That’s a clean, testable question. Build it in AlgoGen and compare. Then build the whole directional system yourself in Python, MQL5, Pine Script, EasyLanguage, or NinjaScript.
This post is educational, not financial advice. Indicators describe the past; they don’t predict the future. Backtest anything before you risk real money on it.