The Relative Strength Index has a whole cottage industry built around it — “premium” scripts, paid add-ons, the works — which is a little absurd once you see how it’s put together. The RSI is arithmetic. Useful arithmetic, but arithmetic you can compute with a calculator. Let’s do the math.
Here’s the one-sentence job of the RSI: over the last N bars, how much of the price movement was up versus down, expressed as a single number between 0 and 100. That’s the whole idea. When almost all the recent movement was upward, RSI runs hot toward 100. When it’s mostly been downward, RSI sinks toward 0. It is a momentum gauge wearing a very tidy, bounded outfit.
The formula, one piece at a time
You need three ingredients: average gains, average losses, and a period (the default is 14).
1. For each bar, compute the change from the previous close.
2. Split those changes into gains (up moves) and losses (down moves, as positives).
3. Average the gains and the losses over N bars.
4. RS = average gain / average loss
5. RSI = 100 - (100 / (1 + RS))
Let’s read that last line, because it’s where the magic bounding happens. If
average loss is zero (every bar went up), RS is infinite and 100 / (1 + ∞)
goes to 0, so RSI = 100. If average gain is zero (every bar went down), RS is 0
and RSI = 100 - 100 = 0. Anything in between lands somewhere on the 0–100
scale. No matter how violent the market gets, the RSI cannot escape that box.
That’s the feature. Raw momentum can run off to any number and is a pain to
compare across assets; the RSI is always speaking the same 0-to-100 language.
One wrinkle: the “average” isn’t a plain moving average. Wilder used a smoothed
average (a running average where each new bar nudges the value by 1/N). It
means the RSI has a memory — one huge up-day keeps influencing the line for a
while instead of dropping out abruptly 14 bars later. Most platforms use
Wilder’s smoothing by default, which is why your hand-rolled simple-average
version won’t quite match TradingView. We’ll match it exactly in the code posts.
A tiny worked example
Say over 14 bars the gains average out to 1.2 and the losses average to 0.8.
RS  = 1.2 / 0.8 = 1.5
RSI = 100 - (100 / (1 + 1.5)) = 100 - 40 = 60
An RSI of 60 — mild upward lean, nothing dramatic. Now imagine a rally where gains average 2.0 and losses average 0.4:
RS  = 2.0 / 0.4 = 5.0
RSI = 100 - (100 / 6) = 100 - 16.7 = 83.3
83 — now we’re in “the crowd is getting excited” territory. See how the number translates the balance of buying and selling pressure into something you can glance at?
How to actually read it
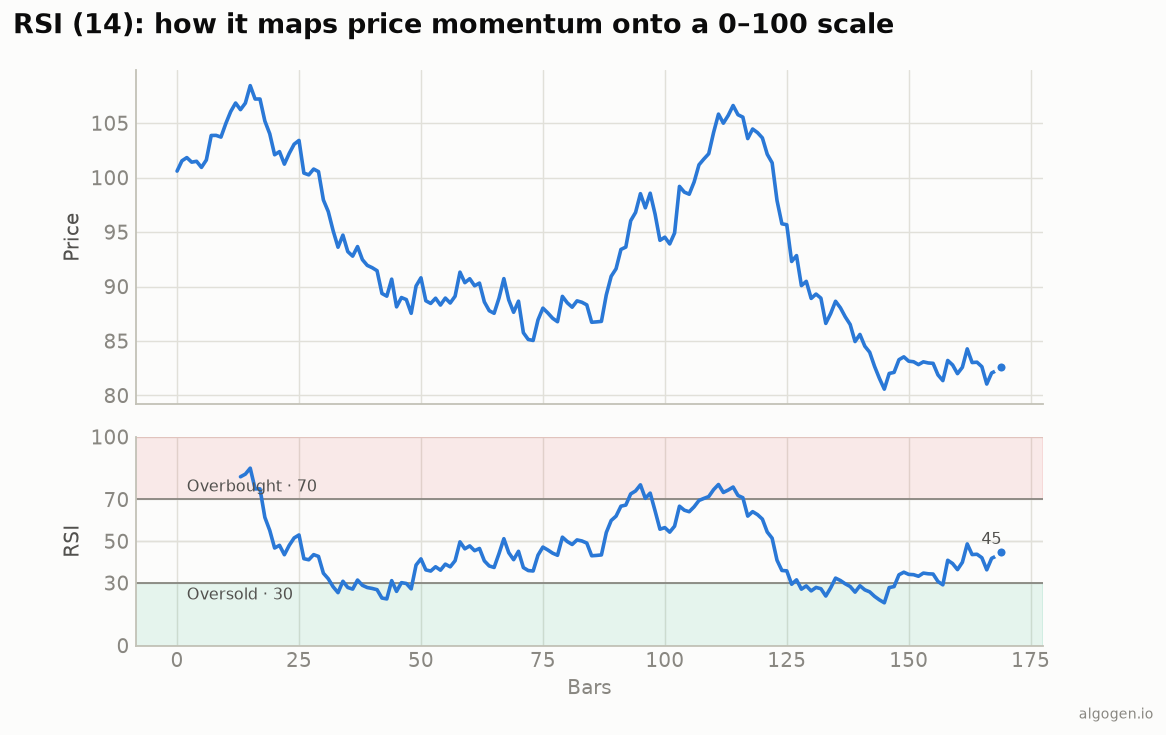
The 70/30 levels. By tradition, above 70 is “overbought” and below 30 is “oversold.” Read those words carefully: overbought does not mean “sell now.” It means recent buying has been lopsided. In a chop or range, RSI tagging 70 and 30 often marks turning points beautifully. In a strong trend, RSI can pin itself above 70 for weeks while price keeps climbing, cheerfully bankrupting anyone who shorted the first “overbought” print.
The 50 midline. A frequently ignored, genuinely useful signal. RSI holding above 50 says momentum is net-positive; below 50, net-negative. Plenty of trend-following folks care more about the 50 cross than the 70/30 tags.
Divergence. This is the RSI’s party trick. If price makes a higher high but RSI makes a lower high, the second push had less momentum behind it than the first — a possible warning that the trend is tiring. Bullish divergence is the mirror image at lows. Divergence is suggestive, not a guarantee; it can persist far longer than your account can.
Settings, and when to change them
The default is 14, straight from Wilder’s book. Shorten it (say 7) and the RSI gets twitchier — more signals, more noise, better for fast timeframes. Lengthen it (21, 25) and it smooths out — fewer, calmer signals, better for position trading. There is no magic number, and anyone who tells you 14 is sacred is selling something. Pick a setting, then test whether it made money, which is the only opinion that matters.
Where it lies to you
- Strong trends. RSI stays overbought/oversold and the naive “fade the extreme” trade gets steamrolled. In a real trend, treat 40–80 as the operating range, not 30–70.
- Whippy ranges. In dead, sideways chop the line ping-pongs across 50 and every cross is noise.
- Divergence that never pays. “The market can stay irrational longer than you can stay solvent” applies directly to divergence signals.
None of this makes the RSI bad. It makes it a lens — one honest view of momentum — rather than a crystal ball. The people who lose money with the RSI are the ones who expected the crystal ball.
Now go test it, don’t trust it
Here’s the Money Mustache move: you now understand the RSI well enough to stop paying anyone for it. The next step isn’t to believe it — it’s to backtest it. Does “buy when RSI crosses back above 30” actually beat buy-and-hold on the thing you trade, after costs? Usually the answer is humbling, and humbling is cheap when it happens in a backtest instead of your brokerage account. Drop the rule into AlgoGen, run it on real history, and let the equity curve tell you the truth. Then read the implementation posts and build the line yourself in whatever platform you already own.
This post is educational, not financial advice. Indicators describe the past; they don’t predict the future. Backtest anything before you risk real money on it.
Sources and further reading
- New Concepts in Technical Trading Systems (Windsor Books)