The Parabolic SAR is those little dots that trail along above or below price and occasionally flip to the other side. “SAR” stands for Stop And Reverse, and that’s exactly what it is: a trailing stop that follows your trade, tightening as the trend runs, and flips to the opposite side when the trend breaks. It’s one of the cleverer risk tools ever built into an indicator. Let’s do the math.
The one-sentence job
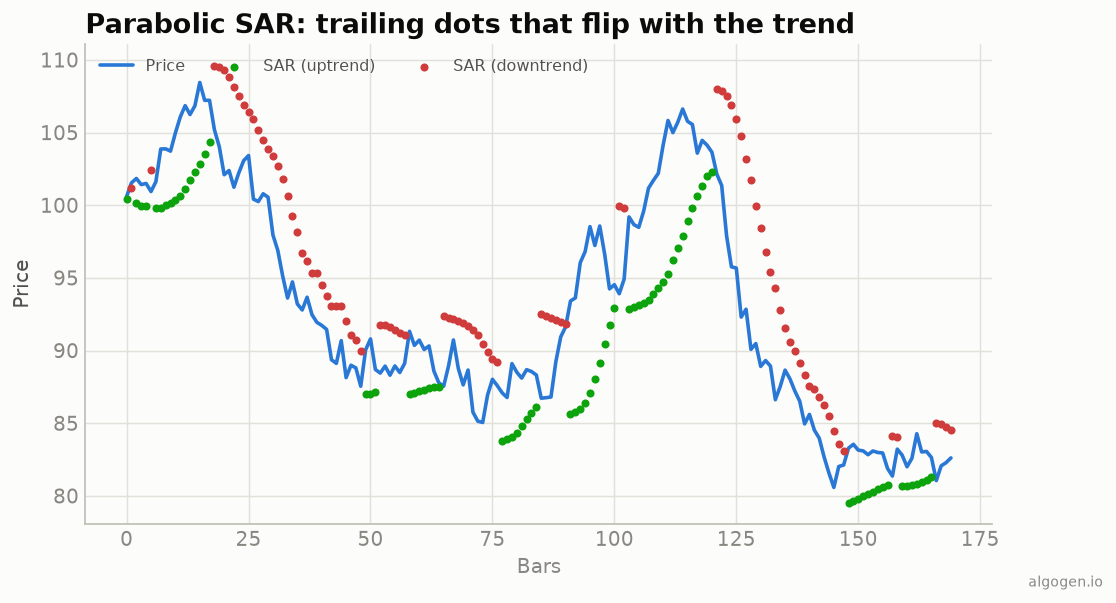
Parabolic SAR places a trailing stop level that moves toward price a little faster each bar a trend persists, and flips to the other side when price crosses it. Dots below price = uptrend; dots above = downtrend.
The three moving parts
The formula is recursive — each dot depends on the last — and it juggles three values. Defaults: AF start 0.02, step 0.02, max 0.20.
- SAR — the stop level itself (the dot).
- EP (Extreme Point) — the highest high reached so far in the current uptrend (or lowest low in a downtrend).
- AF (Acceleration Factor) — starts at 0.02 and increases by 0.02 every time a new extreme point is made, capped at 0.20.
Each bar, the SAR steps toward the extreme point:
Next SAR = Current SAR + AF × (EP − Current SAR)
Because AF grows as the trend makes new highs (or lows), the SAR accelerates toward price — that acceleration is what draws the parabola-like curve of dots and gives the indicator its name. When price finally touches the SAR, the system flips: the trend reverses, the SAR jumps to the other side (starting at the prior EP), AF resets to 0.02, and it begins trailing the new direction.
There’s one guardrail: the SAR is never allowed to move inside the current or prior bar’s range, which prevents it from jumping ahead of price prematurely.
How to read it
Trend direction. Dots below price → uptrend, stay long. Dots above price → downtrend, stay short. It’s about as unambiguous as an indicator gets.
The flip = exit and reverse. When the dots switch sides, the trend has (by this system) reversed. As a pure system, you close your position and open the opposite one — it’s always in the market, long or short, never flat.
As a trailing stop. Even if you don’t trade the flips mechanically, the SAR makes an excellent trailing stop: it ratchets in the direction of your trade and never backs up, locking in more of the move as it accelerates. Many traders use it purely this way, on top of some other entry signal.
Where it lies to you
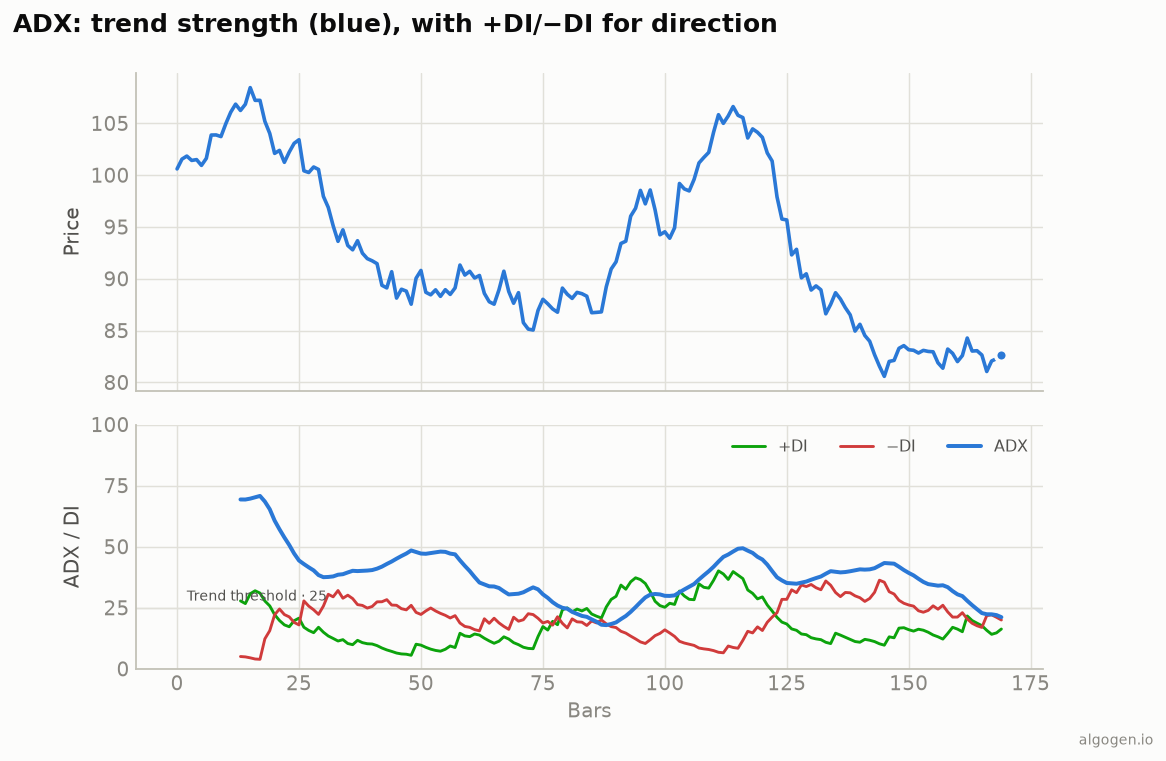
- It’s murder in a range. In choppy, sideways markets the SAR flips constantly, handing you a string of small losses on every fake-out. Parabolic SAR is a trend tool and should be filtered by something that confirms a trend exists (the ADX pairs naturally with it — Wilder designed both).
- Always in the market. As a pure system it has no “flat” state, which means it’s constantly exposed, including during the chop where it performs worst.
- The acceleration cuts both ways. A fast-accelerating SAR locks in gains but also stops you out early in a healthy pullback within a strong trend.
The Parabolic SAR is a beautifully simple idea — a stop that speeds up the longer a trend runs — and it shines as a trailing exit in trending markets. Just don’t turn it loose, unfiltered, in a range, or it will nibble you to death.
Now go test it, don’t trust it
Does trailing with SAR, or trading its flips only when ADX confirms a trend, actually help? Build it in AlgoGen and see. Then build the SAR yourself in Python, MQL5, Pine Script, EasyLanguage, or NinjaScript.
This post is educational, not financial advice. Indicators describe the past; they don’t predict the future. Backtest anything before you risk real money on it.