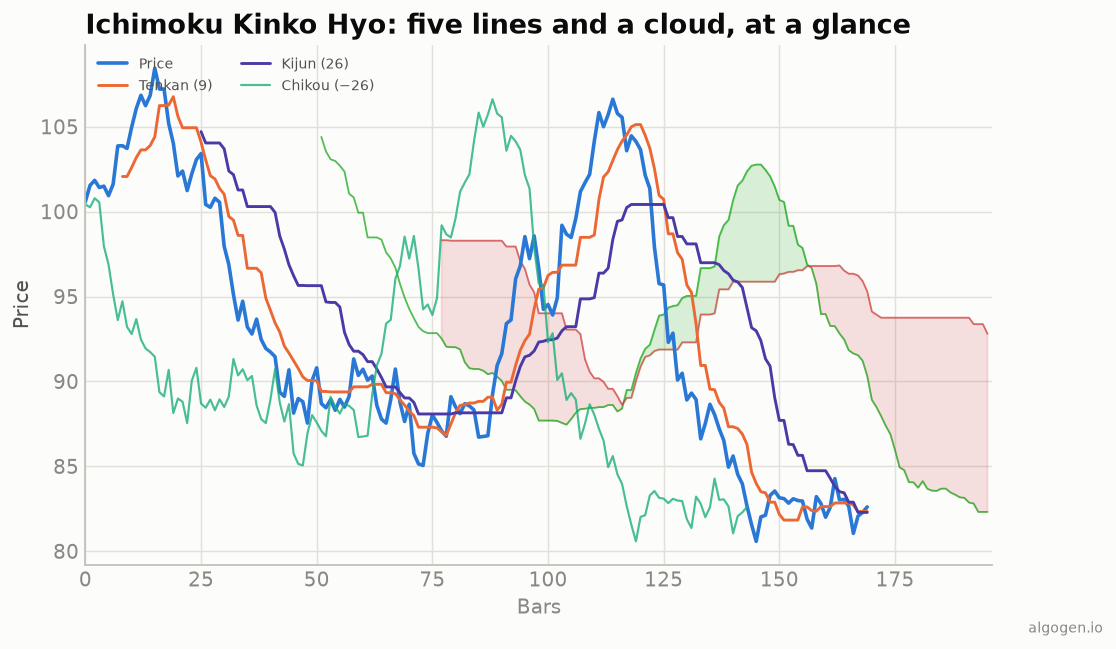
The first time you put Ichimoku on a chart, it looks like someone spilled five indicators and a cloud on top of your price. It is, by a wide margin, the most visually intimidating tool in this series. But the name translates roughly to “one glance equilibrium chart” — the entire point is to read the trend at a glance once you learn the pieces. And every one of those pieces is just a midpoint of a high-low range. Let’s do the math.
The one-sentence job
Ichimoku bundles trend direction, momentum, and support/resistance into one picture, using midpoints of recent ranges plus time displacement. Instead of stacking separate indicators, you get a single system designed to be read holistically.
The five components
Every line is built from the same simple idea: the midpoint of the highest high
and lowest low over some window, (HH + LL) / 2. The defaults are 9, 26, 52.
- Tenkan-sen (Conversion Line) — midpoint over 9 periods. The fast line.
- Kijun-sen (Base Line) — midpoint over 26 periods. The slow line and a key support/resistance level.
- Senkou Span A (Leading Span A) — the average of Tenkan and Kijun, plotted 26 periods into the future.
- Senkou Span B (Leading Span B) — midpoint over 52 periods, also plotted 26 periods into the future.
- Chikou Span (Lagging Span) — the current close, plotted 26 periods into the past.
The Cloud (Kumo) is the shaded area between Senkou Span A and Span B. Because both spans are pushed forward, the cloud famously projects ahead of price — that’s the empty-looking cloud floating to the right of the current bar in the chart above.
How to read it
Price vs the cloud — the headline read:
- Price above the cloud → uptrend / bullish bias.
- Price below the cloud → downtrend / bearish bias.
- Price inside the cloud → no trend; chop; stay cautious.
The cloud itself. A thick cloud means strong support/resistance (the two spans are far apart); a thin cloud is weak. The cloud’s colour flips when Span A crosses Span B — a “Kumo twist” ahead of price that hints at a future trend change. Green (A above B) is bullish; red (B above A) is bearish.
The TK cross. Tenkan crossing above Kijun is a bullish momentum signal (strongest when it happens above the cloud); crossing below is bearish. It’s the Ichimoku equivalent of a fast/slow moving-average cross.
The Chikou. The lagging span confirms: if today’s close (plotted 26 bars back) is above the price action of 26 bars ago, that supports a bullish read; below supports bearish. It’s a quick check that momentum agrees with the trend.
A classic “everything aligned” bullish setup: price above a green cloud, Tenkan above Kijun, and Chikou above past price. When all agree, the system is shouting; when they conflict, it’s telling you to wait.
The settings and why
9, 26, 52 come from Hosoda’s era of a six-day trading week: 26 was roughly a month, 52 roughly two months, 9 about a week and a half. The 26-period forward and backward displacements tie the whole system to that monthly rhythm. Some modern traders adjust to 20/60 for today’s five-day week, but the classic values remain standard — see the history for how they came to be.
Where it lies to you
- It lags. Everything is built from midpoints of past ranges, so Ichimoku confirms trends rather than predicting them.
- It’s miserable in ranges. In choppy, sideways markets price sits in the cloud and every line tangles — Ichimoku is a trend system and says little useful in a range.
- Displacement confuses people. The forward cloud is not “predicting” the future; it’s just today’s spans drawn ahead. And the future portion of the cloud will change as new bars form.
- It was designed for daily charts on Japanese equities/indices; it can work elsewhere, but the defaults carry that heritage.
Ichimoku looks like chaos and is actually a disciplined, self-contained system. The busy-ness is the price of getting trend, momentum, and support/resistance in one view. Learn the five pieces and the “spilled indicators” resolve into a surprisingly clean picture.
Now go test it, don’t trust it
Does an Ichimoku rule — say, “long when price is above a green cloud and Tenkan crosses above Kijun” — actually beat buy-and-hold on your market? Build it in AlgoGen and find out. Then build the whole system yourself in Python, MQL5, Pine Script, EasyLanguage, or NinjaScript.
This post is educational, not financial advice. Indicators describe the past; they don’t predict the future. Backtest anything before you risk real money on it.
Sources and further reading
- Ichimoku: At a Glance (CMT Association)