EasyLanguage calls the exponential moving average XAverage, and it’s the “X” you
reach for whenever a strategy needs a faster-reacting average than the simple
Average. Here’s the EMA from the explainer, the built-in
way and from scratch.
What you’ll need
- TradeStation or MultiCharts
- The EasyLanguage / PowerLanguage Editor, new Indicator
The built-in version
{ AlgoGen EMA Crossover — TradeStation / MultiCharts }
inputs:
    Price( Close ),
    FastLen( 20 ),
    SlowLen( 50 );

variables:
    FastEMA( 0 ),
    SlowEMA( 0 );

FastEMA = XAverage( Price, FastLen );
SlowEMA = XAverage( Price, SlowLen );

Plot1( FastEMA, "Fast EMA" );
Plot2( SlowEMA, "Slow EMA" );

if FastEMA crosses over SlowEMA then
    Alert( "EMA bull cross" )
else if FastEMA crosses under SlowEMA then
    Alert( "EMA bear cross" );
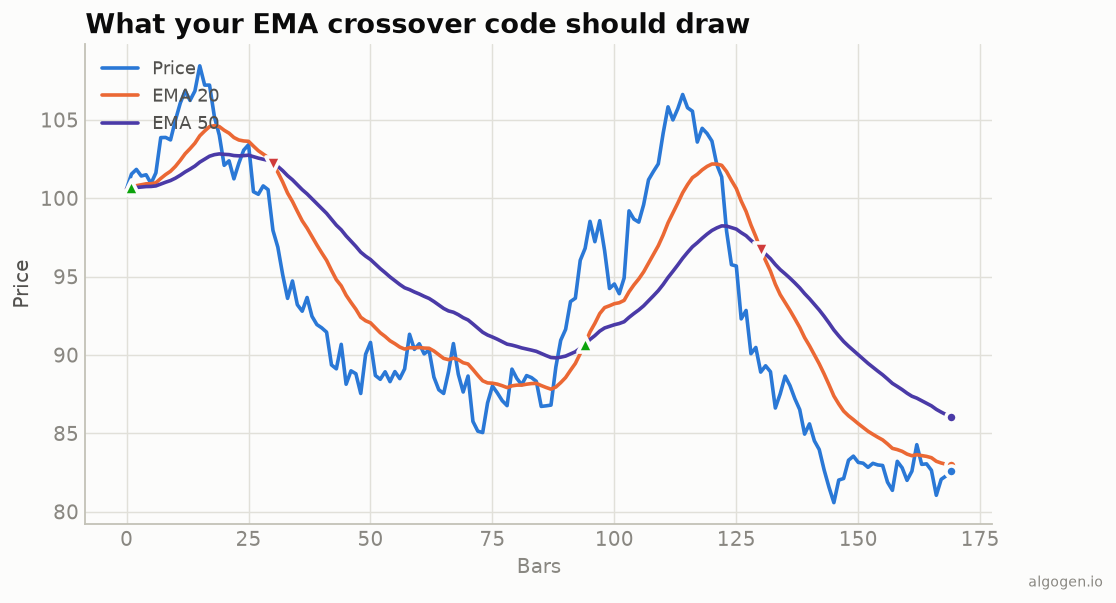
XAverage( Price, Length ) is the exponential moving average with the standard
α = 2/(Length+1). Apply it as an overlay and you get the orange/violet EMAs from
the output chart.
The from-scratch version
To see the recurrence, EasyLanguage lets you reference a variable’s prior bar with
[1]:
{ AlgoGen EMA (manual) }
inputs: Price( Close ), Length( 20 );
variables: Alpha( 0 ), EMAval( 0 );

Alpha = 2 / ( Length + 1 );

if CurrentBar = 1 then
    EMAval = Price                                  { seed }
else
    EMAval = Alpha * Price + ( 1 - Alpha ) * EMAval[1];

Plot1( EMAval, "EMA" );
A crossover strategy
{ AlgoGen EMA Cross — Strategy }
inputs: FastLen( 20 ), SlowLen( 50 );
variables: F( 0 ), S( 0 );
F = XAverage( Close, FastLen );
S = XAverage( Close, SlowLen );
if F crosses over S then Buy next bar at market
else if F crosses under S then Sell next bar at market;
Run the Strategy Performance Report to see whether the EMA cross actually earned its keep on your instrument.
Gotchas
XAverage, notAverage.Averageis the simple (equal-weight) MA;XAverageis exponential. Mixing them up gives a completely different line.- Seeding.
XAverageseeds internally; the manual version seeds from the first price, so expect a tiny early-bar difference. next bar at marketavoids look-ahead in the strategy.
Same indicator elsewhere: Python, MQL5, Pine Script, NinjaScript. Then backtest it in AlgoGen.
This post is educational, not financial advice. Indicators describe the past; they don’t predict the future. Backtest anything before you risk real money on it.
Sources and further reading
- Statistical Forecasting for Inventory Control (Royal Statistical Society and Oxford Academic)
- What is EasyLanguage? (TradeStation)