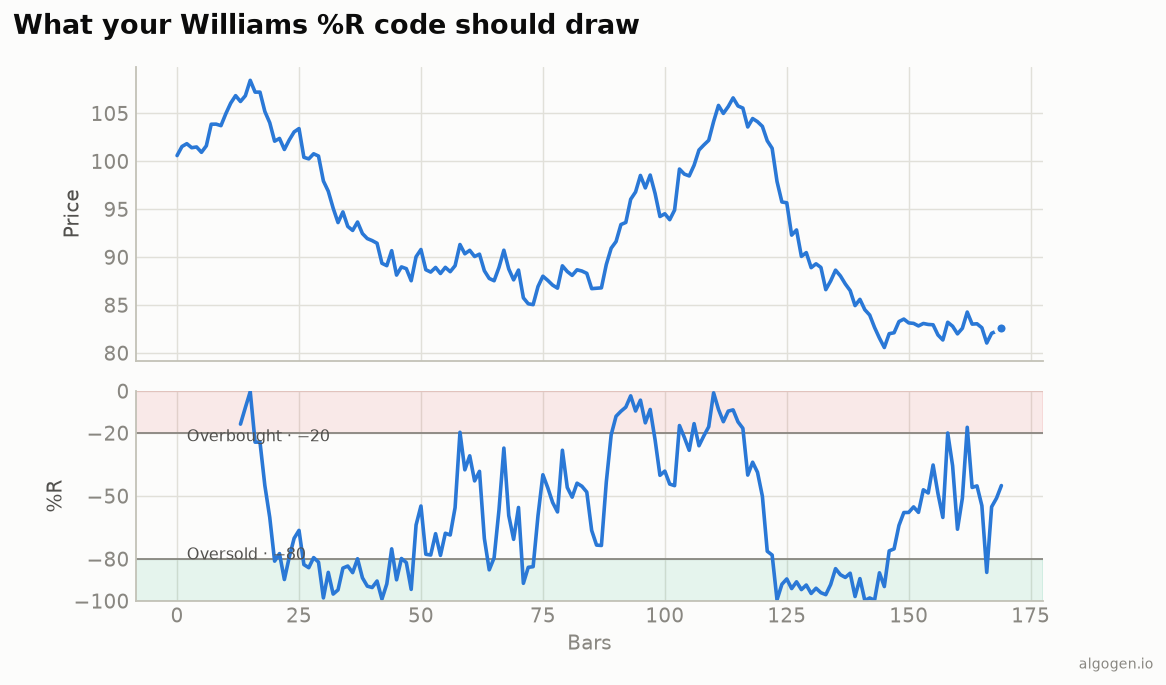
Williams %R in NinjaScript is a short oscillator that reuses the rolling high/low pattern from earlier posts. See the explainer for the concept.
What you’ll need
- NinjaTrader 8
- New → NinjaScript Editor → Indicators → New Indicator, name it
AlgoGenWilliamsR
The source
#region Using declarations
using System;
using System.Windows.Media;
using NinjaTrader.NinjaScript;
using NinjaTrader.NinjaScript.Indicators;
#endregion

namespace NinjaTrader.NinjaScript.Indicators
{
    public class AlgoGenWilliamsR : Indicator
    {
        protected override void OnStateChange()
        {
            if (State == State.SetDefaults)
            {
                Name        = "AlgoGen Williams %R";
                Description = "Williams %R (-100 to 0)";
                Period      = 14;
                IsOverlay   = false;

                AddPlot(new Stroke(Brushes.DodgerBlue, 2), PlotStyle.Line, "PercentR");
                AddLine(Brushes.Gray, -20, "Overbought");
                AddLine(Brushes.Gray, -80, "Oversold");
            }
        }

        protected override void OnBarUpdate()
        {
            if (CurrentBar < Period - 1)
                return;

            double hh = High[0], ll = Low[0];
            for (int i = 1; i < Period; i++)
            {
                if (High[i] > hh) hh = High[i];
                if (Low[i]  < ll) ll = Low[i];
            }
            double range = hh - ll;
            PercentR[0] = range == 0.0 ? -50.0 : -100.0 * (hh - Close[0]) / range;
        }

        #region Properties
        [NinjaScriptProperty]
        [System.ComponentModel.DataAnnotations.Range(1, int.MaxValue)]
        [System.ComponentModel.Display(Name = "Period", GroupName = "Parameters", Order = 0)]
        public int Period { get; set; }

        [Gui.Browsable(false)] [System.Xml.Serialization.XmlIgnore]
        public Series<double> PercentR => Values[0];
        #endregion
    }
}
Compile & apply
- Press F5 to compile.
- Add AlgoGen Williams %R to a chart; it draws in its own panel between −100 and 0 with the level lines, matching the output chart.
Gotchas
- Flat-range guard.
range == 0.0 ? -50.0prevents a divide-by-zero on a perfectly flat window. - Negative scale. NinjaTrader auto-scales the panel to the −100..0 range; the
AddLinecalls place the −20/−80 guides. - Add smoothing if noisy. Wrap the output in an
SMAin a strategy, or plot a second smoothed series, to tame the raw %R’s jumpiness. - Trend-filter your signals. In a strategy, only act on oversold exits when a longer average confirms an uptrend:
// In a strategy's OnBarUpdate:
if (Close[0] > SMA(200)[0] && PercentR[0] > -80 && PercentR[1] <= -80)
    EnterLong();
- Negative-scale reads. Remember −80 is “more oversold” than −20; comparisons read backwards from a 0-to-100 oscillator, so double-check your inequalities.
That’s the five-language set: Python, MQL5, Pine Script, EasyLanguage, and this one. Now test a Williams %R rule in AlgoGen.
This post is educational, not financial advice. Indicators describe the past; they don’t predict the future. Backtest anything before you risk real money on it.
Sources and further reading
- Larry Williams' indicator chronology (I Really Trade)
- NinjaScript system indicator methods (NinjaTrader)