Williams %R is a natural fit for EasyLanguage — a compact oscillator you can build in a few lines or call directly. See the explainer for the concept and the negative scale.
What you’ll need
- TradeStation or MultiCharts
- The EasyLanguage / PowerLanguage Editor, new Indicator
The from-scratch version
{ AlgoGen Williams %R — TradeStation / MultiCharts }
inputs:
    Length( 14 ),
    OverBought( -20 ),
    OverSold( -80 );

variables:
    HH( 0 ), LL( 0 ), Rng( 0 ), PctR( 0 );

HH  = Highest( High, Length );
LL  = Lowest( Low, Length );
Rng = HH - LL;

if Rng = 0 then
    PctR = -50
else
    PctR = -100 * ( HH - Close ) / Rng;

Plot1( PctR, "%R" );
Plot2( OverBought, "OB" );
Plot3( OverSold, "OS" );
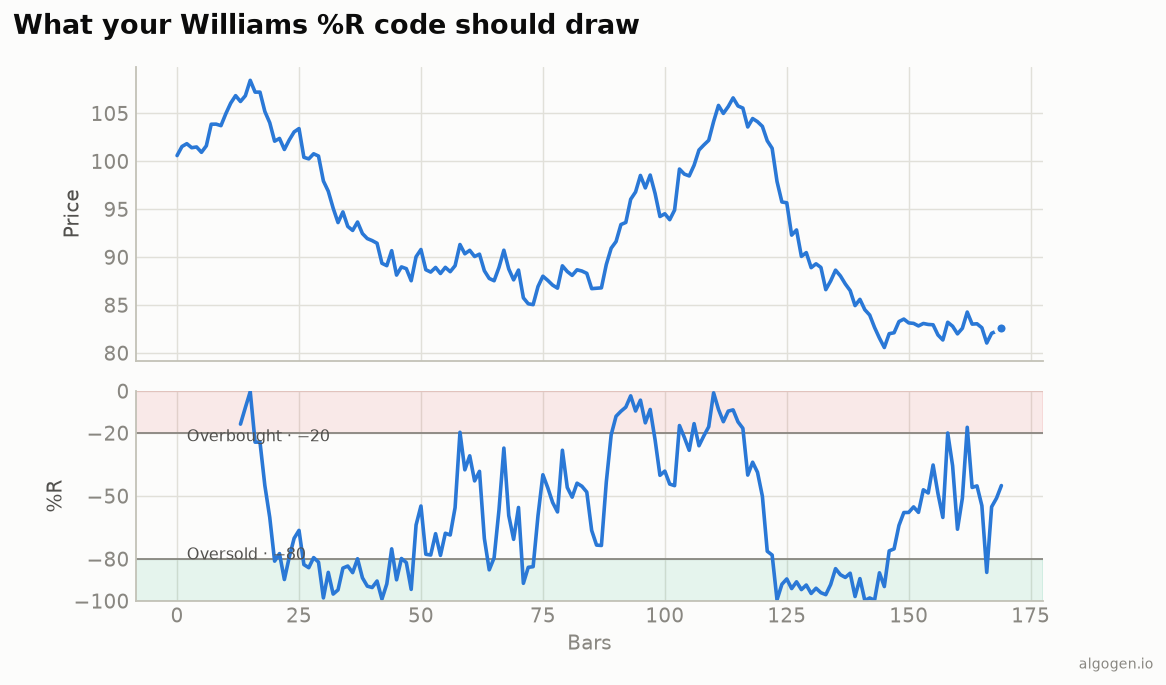
Highest/Lowest give the range, and -100 * (HH - Close) / Rng is the classic
formula, plotted on the −100-to-0 scale with the −20/−80 guides from the output
chart.
The built-in shortcut
TradeStation ships a WilliamsR( Length ) function (and MultiCharts a comparable
one) that returns the same value:
Plot1( WilliamsR( Length ), "%R" );
Handy, but the explicit version makes the range math and the flat-range guard visible.
A trend-filtered strategy
{ AlgoGen %R Bounce — Strategy }
inputs: Length( 14 ), TrendLen( 200 );
variables: HH( 0 ), LL( 0 ), PctR( 0 );

HH = Highest( High, Length );
LL = Lowest( Low, Length );
PctR = -100 * ( HH - Close ) / ( HH - LL );

{ Only buy oversold bounces while price is above its long average }
if Close > Average( Close, TrendLen )
   and PctR crosses over -80 then
    Buy next bar at market;

if PctR crosses under -20 then
    Sell next bar at market;
Run the Strategy Performance Report to judge whether the trend filter earns its keep versus fading extremes blindly.
Gotchas
- Negative scale. Williams %R is −100 to 0; set the sub-graph scaling and the level lines to match, or the overbought/oversold guides won’t line up.
Rng = 0guard. A flat window would divide by zero; substituting −50 (mid-range) keeps the plot sane.- Add smoothing if needed.
Average( PctR, 3 )tames the raw %R’s jumpiness for cleaner signals.
Same indicator elsewhere: Python, MQL5, Pine Script, NinjaScript. Then backtest it in AlgoGen.
This post is educational, not financial advice. Indicators describe the past; they don’t predict the future. Backtest anything before you risk real money on it.
Sources and further reading
- Larry Williams' indicator chronology (I Really Trade)
- What is EasyLanguage? (TradeStation)