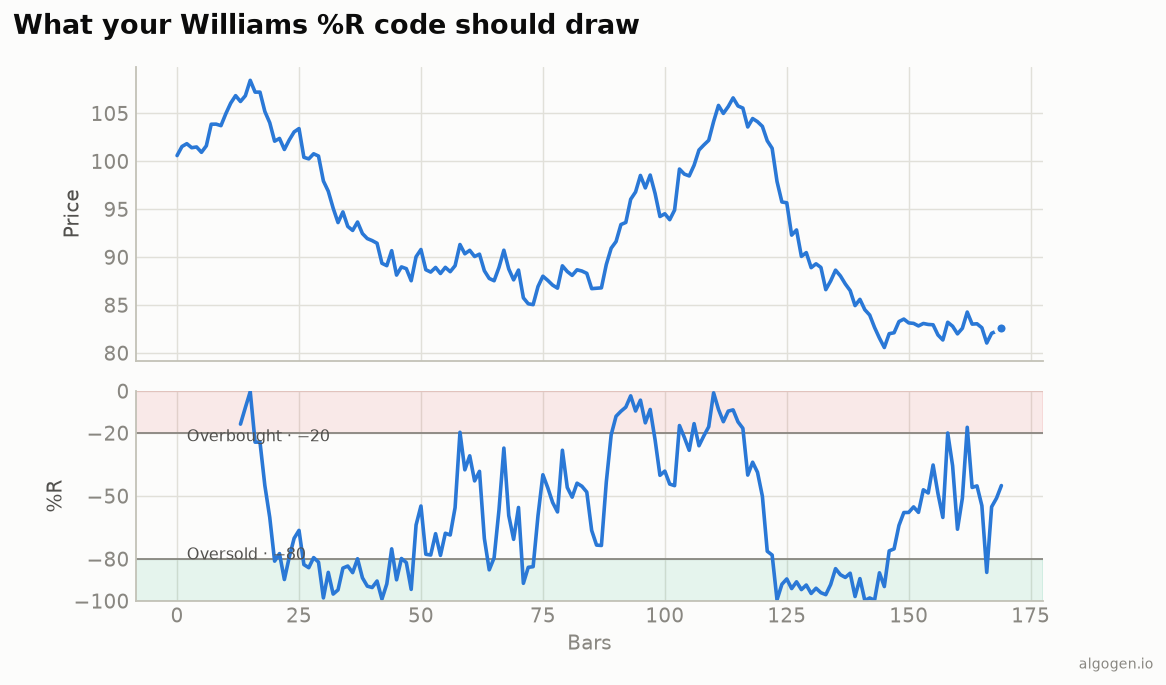
Williams %R in MQL5 is a compact separate-window oscillator — a nice, short custom indicator. See the explainer for the concept and the negative scale.
What you’ll need
- MetaTrader 5 with MetaEditor
- Save as
AlgoGen.WilliamsR.mq5underMQL5/Indicators/
The source
//+------------------------------------------------------------------+
//|                                            AlgoGen.WilliamsR.mq5 |
//|                                          Copyright 2026, AlgoGen |
//|                                           https://www.algogen.io |
//+------------------------------------------------------------------+
#property copyright "Copyright 2026, AlgoGen"
#property link      "https://www.algogen.io"
#property version   "1.00"
#property indicator_separate_window
#property indicator_minimum -100
#property indicator_maximum 0
#property indicator_buffers 1
#property indicator_plots   1

#property indicator_label1  "%R"
#property indicator_type1   DRAW_LINE
#property indicator_color1  clrDodgerBlue
#property indicator_width1  2
#property indicator_level1  -20.0
#property indicator_level2  -80.0

input int InpPeriod = 14; // %R period

double WRBuffer[];

int OnInit()
  {
   SetIndexBuffer(0, WRBuffer, INDICATOR_DATA);
   IndicatorSetString(INDICATOR_SHORTNAME, "AlgoGen %R(" + (string)InpPeriod + ")");
   return(INIT_SUCCEEDED);
  }

int OnCalculate(const int rates_total, const int prev_calculated,
                const datetime &time[], const double &open[],
                const double &high[],   const double &low[],
                const double &close[],  const long &tick_volume[],
                const long &volume[],   const int &spread[])
  {
   if(rates_total < InpPeriod)
      return(0);

   int start = (prev_calculated > InpPeriod) ? prev_calculated - 1 : InpPeriod - 1;

   for(int i = start; i < rates_total; i++)
     {
      double hh = high[i], ll = low[i];
      for(int j = 1; j < InpPeriod; j++)
        {
         if(high[i - j] > hh) hh = high[i - j];
         if(low[i - j]  < ll) ll = low[i - j];
        }
      double range = hh - ll;
      WRBuffer[i] = (range == 0.0) ? -50.0 : -100.0 * (hh - close[i]) / range;
     }
   return(rates_total);
  }
//+------------------------------------------------------------------+
Install & compile
- Drop it in
MQL5/Indicators/, press F7. - Drag onto a chart — a separate window shows the %R line between −100 and 0 with the −20/−80 level lines, matching the output chart.
Gotchas
- Fixed scale.
indicator_minimum -100/indicator_maximum 0pin the sub- window so the levels sit correctly; without them MT5 auto-scales and the −20/−80 guides drift. - Flat-range guard.
(range == 0.0) ? -50.0fills a neutral mid-value when the window is perfectly flat instead of dividing by zero. - Built-in / MQL4. MT5 has
iWPR; MQL4 does too. The custom version is for learning and for exposing the buffer to an EA. - Using it in an EA. Read the buffer with
CopyBuffer, and consider gating signals on a trend filter (e.g. only buy %R crossing up through −80 when price is above a long moving average) — fading extremes blindly gets punished in trends. - Add smoothing. For calmer signals, average the raw %R with a short SMA on a second buffer; %R is unsmoothed and pokes the extremes often.
Same indicator elsewhere: Python, Pine Script, EasyLanguage, NinjaScript. Then test a %R rule in AlgoGen.
This post is educational, not financial advice. Indicators describe the past; they don’t predict the future. Backtest anything before you risk real money on it.
Sources and further reading
- Larry Williams' indicator chronology (I Really Trade)
- Technical indicator functions (MetaQuotes)