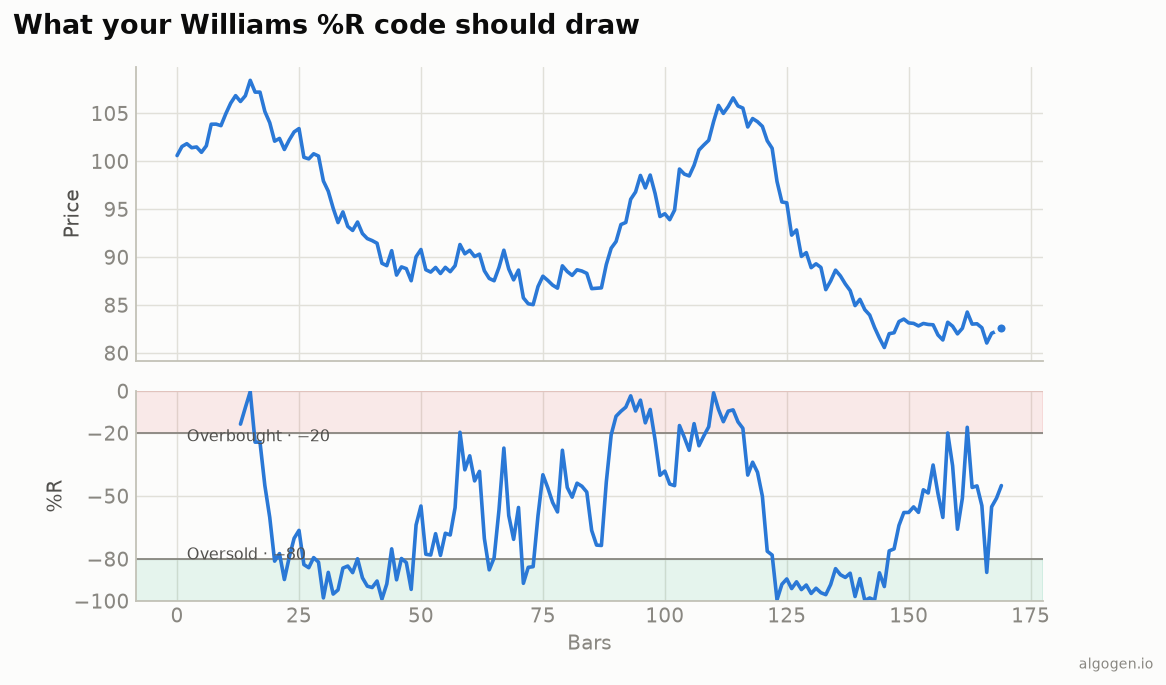
Williams %R is a two-line indicator, as the explainer showed: distance from the recent high, scaled by the range, times −100. Here it is in pandas, plus the smoothing and stochastic-relationship tricks worth knowing.
What you’ll need
- Python 3.9+,
pandas/numpy high,low,closeseries.
From scratch
import numpy as np


def williams_r(high, low, close, period: int = 14):
    highest = high.rolling(period).max()
    lowest = low.rolling(period).min()

    rng = (highest - lowest).replace(0, np.nan)     # flat-range guard
    return -100 * (highest - close) / rng
highest - close is the distance from the top of the range; dividing by the range
and multiplying by −100 puts it on the 0-to−100 scale from the output chart. The
replace(0, np.nan) guards the rare flat window where high equals low.
The stochastic relationship, in code
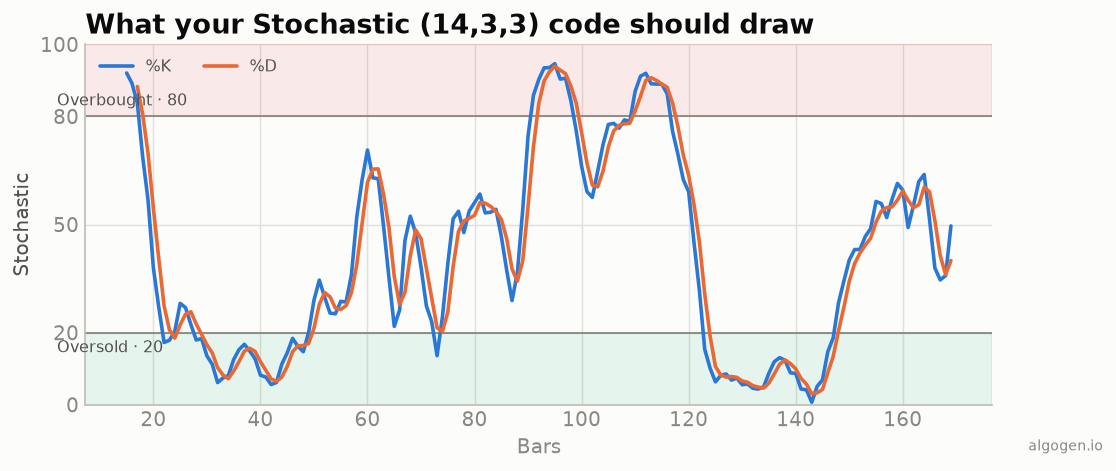
To see that %R is just an inverted fast stochastic %K:
fast_k = 100 * (close - low.rolling(14).min()) / (
    high.rolling(14).max() - low.rolling(14).min())
wr = williams_r(high, low, close, 14)

# These are equal (to floating point): wr == fast_k - 100
print((wr - (fast_k - 100)).abs().max())   # ~0
If you already compute the stochastic, you can derive %R for free — they carry the same information.
Optional smoothing
%R is unsmoothed and jumpy; many traders average it:
wr_smooth = williams_r(high, low, close, 14).rolling(3).mean()
Gotchas
- Sign and scale. The classic scale is −100 (bottom) to 0 (top). Some libraries return 0 to 100 instead — check before comparing.
- Range from highs/lows, not closes. Use the actual
highandlowfor the range; a common bug is using close-based rolling max/min. - Flat range.
replace(0, np.nan)avoids dividing by zero on a perfectly flat window.
A trend-aware signal
Trading %R naively (“buy oversold”) gets destroyed in trends. A more sensible version only takes oversold bounces in an uptrend, using a moving-average filter:
wr = williams_r(high, low, close, 14)
uptrend = close > close.rolling(200).mean()
# Buy when %R climbs back out of oversold while the trend is up.
signal = uptrend & (wr > -80) & (wr.shift(1) <= -80)
signal fires when %R crosses up through −80 (leaving oversold) but only while
price is above its 200-day average — a far more defensible use than fading every
extreme. Backtest it in AlgoGen before believing it.
The lazy one-liner
import pandas_ta as ta
df["willr"] = ta.willr(df["high"], df["low"], df["close"], length=14)
Same indicator elsewhere: MQL5, Pine Script, EasyLanguage, NinjaScript.
This post is educational, not financial advice. Indicators describe the past; they don’t predict the future. Backtest anything before you risk real money on it.
Sources and further reading
- Larry Williams' indicator chronology (I Really Trade)
- Windowing operations (pandas documentation)