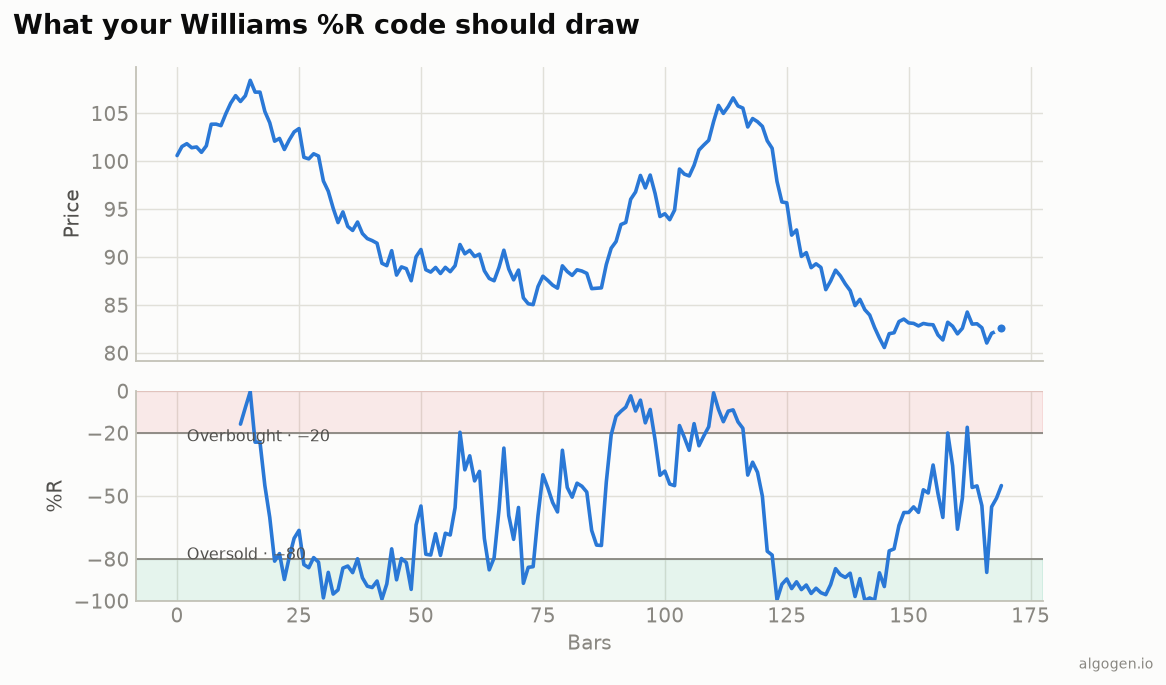
Pine has ta.wpr for Williams %R built in, so plotting it from
the explainer is a one-liner — but the from-scratch
version is short enough to be worth seeing too.
What you’ll need
- A TradingView account (free tier is fine)
- The Pine Editor
The source
//@version=5
indicator("AlgoGen Williams %R", shorttitle="AG %R", overlay=false)

length = input.int(14, "Length", minval=1)
wr = ta.wpr(length)

plot(wr, "%R", color=#2a78d6, linewidth=2)
h20 = hline(-20, "Overbought", color=color.gray)
h80 = hline(-80, "Oversold",   color=color.gray)
fill(hline(0),   h20, color=color.new(#e34948, 90))
fill(h80, hline(-100), color=color.new(#1baf7a, 90))
ta.wpr(length) returns the classic −100 to 0 Williams %R. The two fill calls
shade the overbought band (near 0) and oversold band (near −100), matching the
output chart.
From scratch (and smoothed)
//@version=5
indicator("AlgoGen %R (manual)", overlay=false)
length = input.int(14, "Length")
smooth = input.int(1,  "Smoothing (1 = raw)")
hh = ta.highest(high, length)
ll = ta.lowest(low, length)
wrManual = -100 * (hh - close) / (hh - ll)
plot(ta.sma(wrManual, smooth), color=#2a78d6, linewidth=2)
Set smooth above 1 to average the jumpy raw %R — a common way to cut its noise.
Trend-aware alerts
Fading every extreme is a good way to lose money in a trend, so gate the signals on a trend filter and alert only on the sensible ones:
uptrend = close > ta.sma(close, 200)
exitOversold   = uptrend and ta.crossover(wr, -80)
exitOverbought = not uptrend and ta.crossunder(wr, -20)
plotshape(exitOversold,   "Long",  shape.triangleup,   location.bottom, color=#0ca30c, size=size.tiny)
plotshape(exitOverbought, "Short", shape.triangledown, location.top,    color=#d03b3b, size=size.tiny)
alertcondition(exitOversold, "WR long", "%R left oversold in an uptrend")
This marks %R leaving oversold only when price is above its 200-SMA — the kind of context that turns a blunt oscillator into something worth testing.
Gotchas
- The negative scale. Williams %R runs −100 to 0. Set the pane and level lines accordingly; don’t mix it up with a 0-to-100 oscillator on the same scale.
ta.wprtakes only length. It uses the chart’s high/low/close implicitly; the manual version spells them out.- Flat range. In a dead-flat window
hh - llis 0;ta.wprhandles it, but a fully manual version should guard against division by zero.
Same indicator elsewhere: Python, MQL5, EasyLanguage, NinjaScript. Then test it in AlgoGen.
This post is educational, not financial advice. Indicators describe the past; they don’t predict the future. Backtest anything before you risk real money on it.
Sources and further reading
- Larry Williams' indicator chronology (I Really Trade)
- Pine Script built-ins (TradingView)