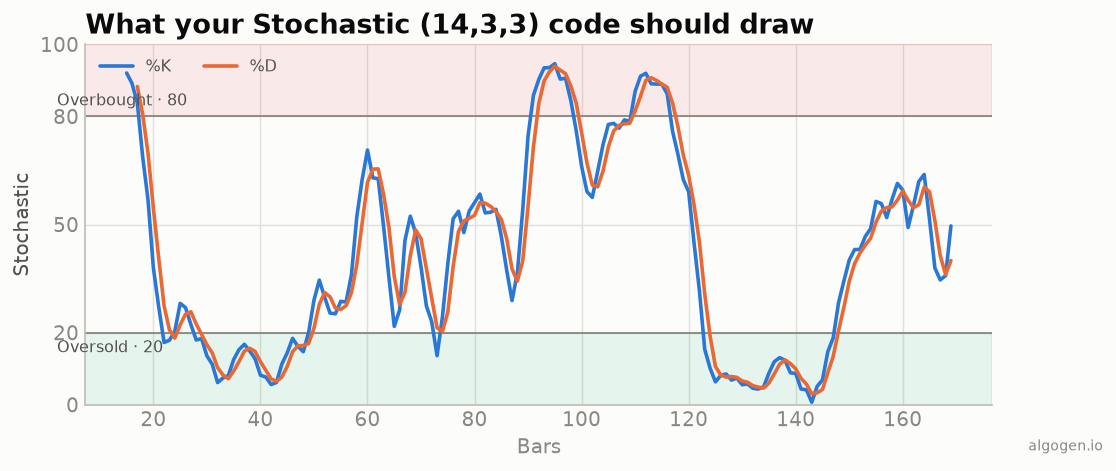
Building your own stochastic in MQL5 is a good way to learn how MT5 handles range-based indicators — highest highs, lowest lows, and chained smoothing. See the explainer for what we’re drawing.
What you’ll need
- MetaTrader 5 with MetaEditor
- Save as
AlgoGen.Stochastic.mq5underMQL5/Indicators/
The source
We compute raw %K, smooth it into slow %K, then average that for %D.
//+------------------------------------------------------------------+
//|                                          AlgoGen.Stochastic.mq5  |
//|                                          Copyright 2026, AlgoGen |
//|                                           https://www.algogen.io |
//+------------------------------------------------------------------+
#property copyright "Copyright 2026, AlgoGen"
#property link      "https://www.algogen.io"
#property version   "1.00"
#property indicator_separate_window
#property indicator_minimum 0
#property indicator_maximum 100
#property indicator_buffers 3
#property indicator_plots   2

#property indicator_label1  "%K"
#property indicator_type1   DRAW_LINE
#property indicator_color1  clrDodgerBlue
#property indicator_width1  2
#property indicator_label2  "%D"
#property indicator_type2   DRAW_LINE
#property indicator_color2  clrOrangeRed
#property indicator_width2  2
#property indicator_level1  20.0
#property indicator_level2  80.0

input int InpK      = 14; // %K length
input int InpSlow   = 3;  // %K smoothing (slow)
input int InpD      = 3;  // %D length

double KBuffer[], DBuffer[], RawK[];

int OnInit()
  {
   SetIndexBuffer(0, KBuffer, INDICATOR_DATA);
   SetIndexBuffer(1, DBuffer, INDICATOR_DATA);
   SetIndexBuffer(2, RawK,    INDICATOR_CALCULATIONS);
   IndicatorSetString(INDICATOR_SHORTNAME,
      StringFormat("AlgoGen Stoch(%d,%d,%d)", InpK, InpSlow, InpD));
   return(INIT_SUCCEEDED);
  }

double SmaOf(const double &buf[], int i, int period)
  {
   double s = 0.0;
   for(int j = 0; j < period; j++) s += buf[i - j];
   return s / period;
  }

int OnCalculate(const int rates_total, const int prev_calculated,
                const datetime &time[], const double &open[],
                const double &high[],   const double &low[],
                const double &close[],  const long &tick_volume[],
                const long &volume[],   const int &spread[])
  {
   if(rates_total < InpK + InpSlow + InpD)
      return(0);

   int start = (prev_calculated > InpK) ? prev_calculated - 1 : InpK - 1;

   // Raw %K.
   for(int i = start; i < rates_total; i++)
     {
      double hh = high[i], ll = low[i];
      for(int j = 1; j < InpK; j++)
        {
         if(high[i - j] > hh) hh = high[i - j];
         if(low[i - j]  < ll) ll = low[i - j];
        }
      double range = hh - ll;
      RawK[i] = (range == 0.0) ? 50.0 : 100.0 * (close[i] - ll) / range;
     }

   // Slow %K = SMA(rawK, InpSlow); %D = SMA(slowK, InpD).
   int s2 = MathMax(start, InpK - 1 + InpSlow - 1);
   for(int i = s2; i < rates_total; i++)
      KBuffer[i] = SmaOf(RawK, i, InpSlow);

   int s3 = MathMax(start, InpK - 1 + InpSlow - 1 + InpD - 1);
   for(int i = s3; i < rates_total; i++)
      DBuffer[i] = SmaOf(KBuffer, i, InpD);

   return(rates_total);
  }
//+------------------------------------------------------------------+
Install & compile
- Drop it in
MQL5/Indicators/, press F7. - Drag onto a chart — a separate window shows blue %K and orange %D with the 20/80 lines, matching the output chart.
Gotchas
- Flat-range guard.
(range == 0.0) ? 50.0avoids dividing by zero on a perfectly flat window; 50 (mid-range) is a reasonable neutral fill. - Chained warm-up. Each smoothing stage needs its own extra bars, hence the
s2/s3start offsets — get these wrong and you smooth garbage at the left edge. - MQL4? Same math; MQL4 also has
iStochastic, but rolling your own gives you the exact smoothing control.
Same indicator elsewhere: Python, Pine Script, EasyLanguage, NinjaScript. Then backtest it in AlgoGen.
This post is educational, not financial advice. Indicators describe the past; they don’t predict the future. Backtest anything before you risk real money on it.
Sources and further reading
- The Origins of the Stochastic Oscillator (CMT Association)
- Technical indicator functions (MetaQuotes)