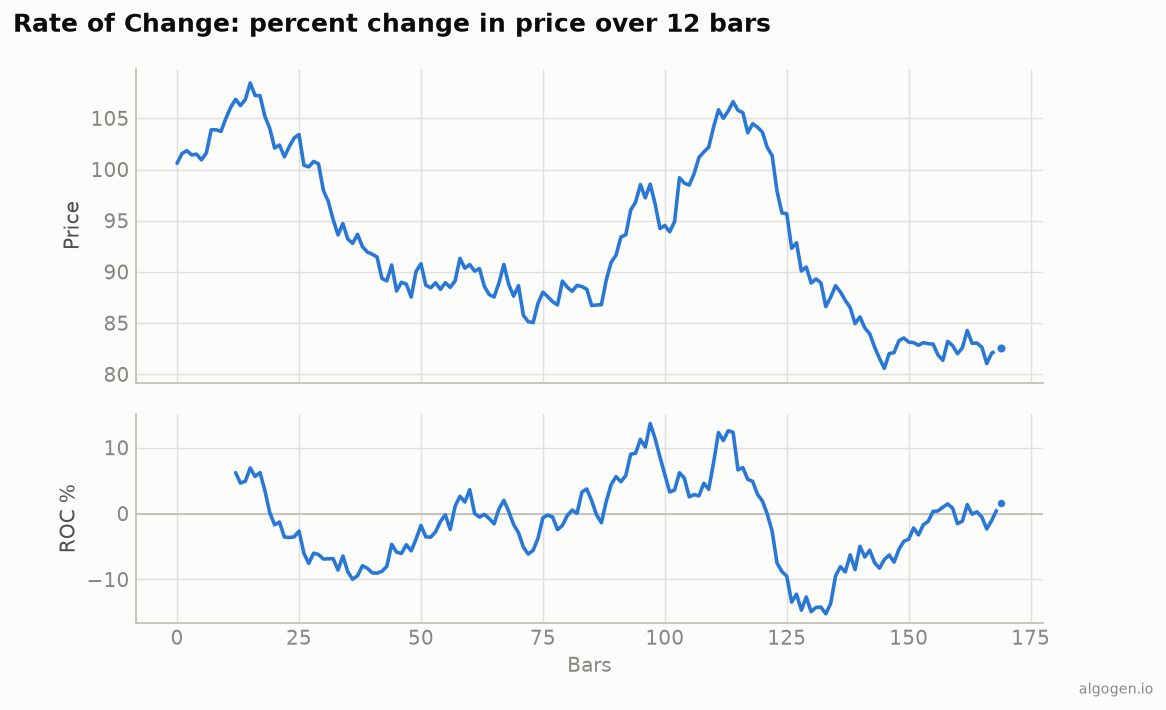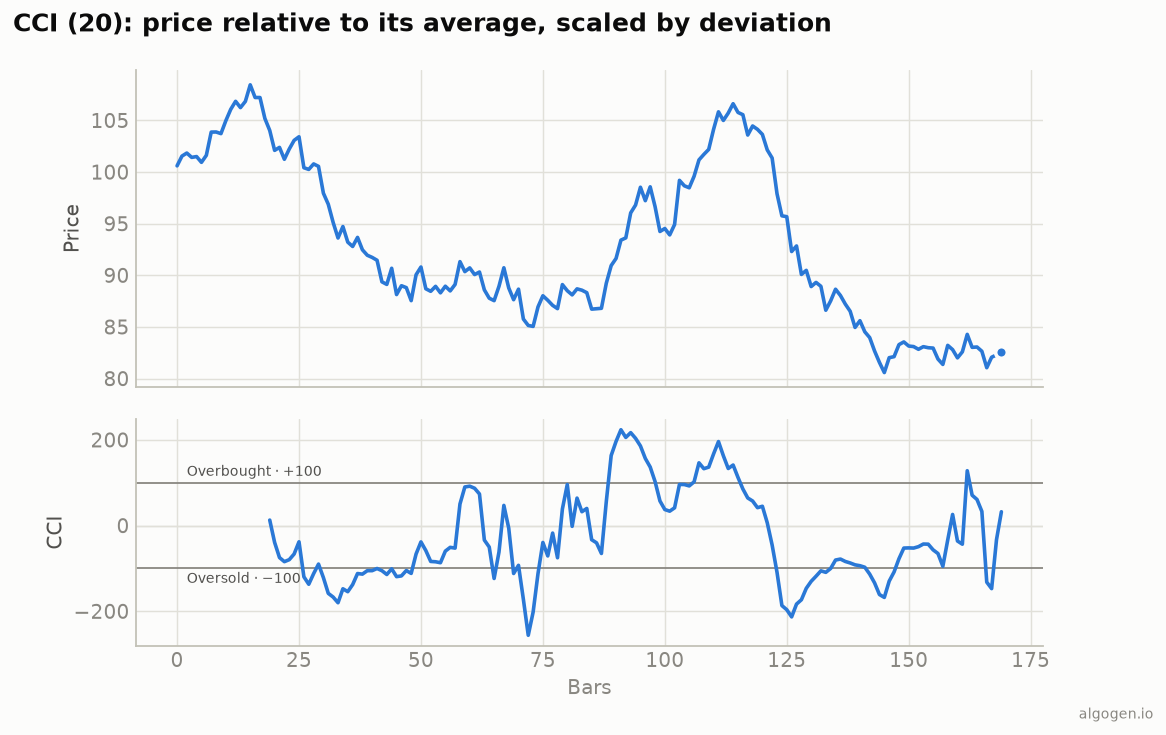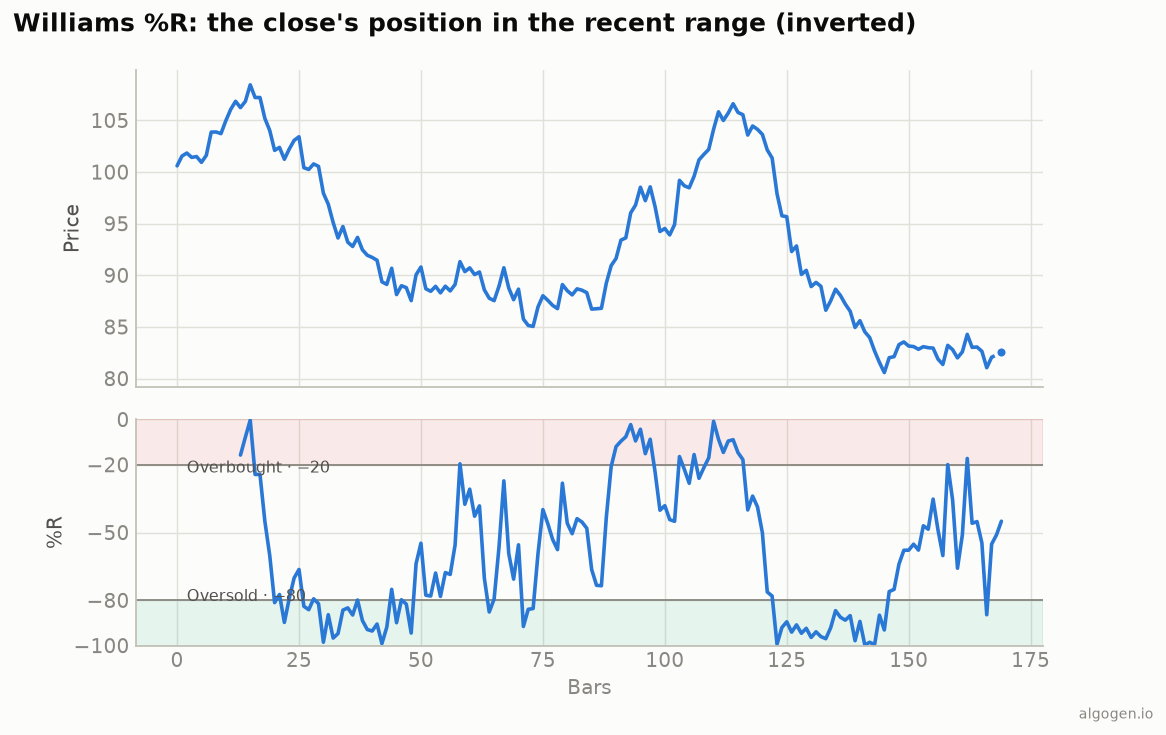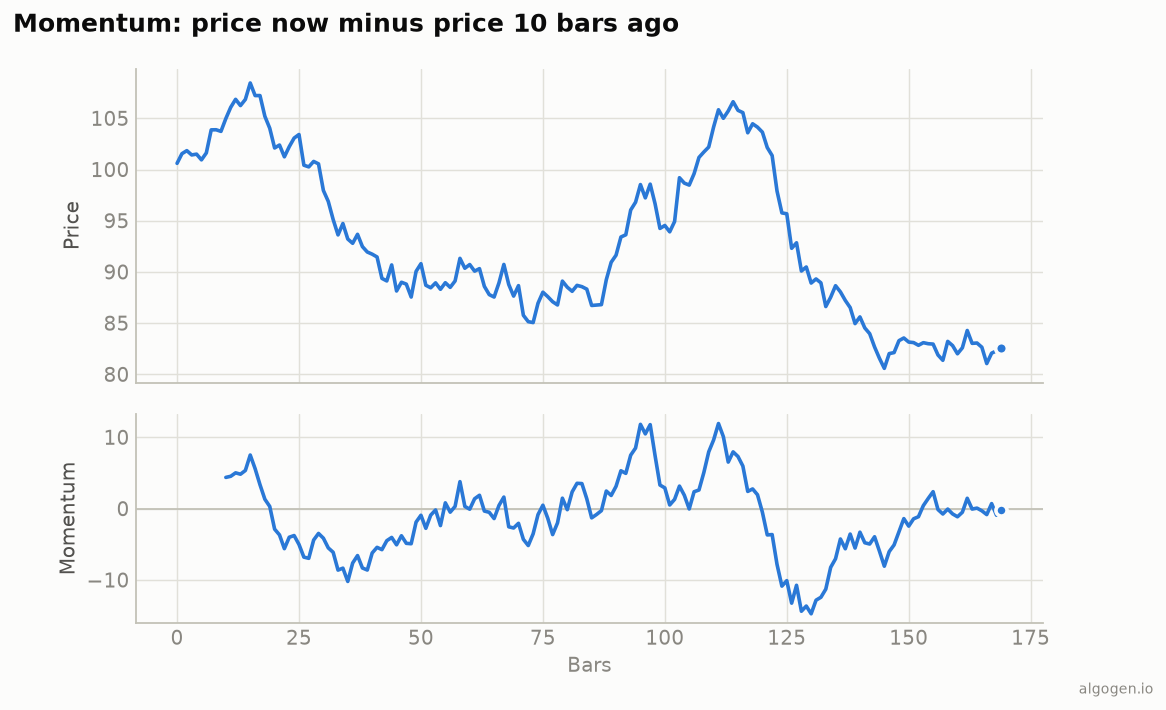
If the Rate of Change is momentum for people who like percentages, the Momentum indicator is momentum for people who like it even simpler. It’s today’s price minus the price N bars ago. Full stop. It’s the most literal possible measure of “is price higher or lower than it was, and by how much.” Let’s do the (trivial) math.
The one-sentence job
Momentum is the difference between the current price and the price N bars ago. Positive = price is higher than it was (upward momentum); negative = lower. The farther from zero, the faster the move.
The formula
With a common period of 10:
Momentum = Close − Close N bars ago
That’s the classic form, oscillating around a zero line (as in the chart above). There’s also a widely-used ratio form:
Momentum = 100 × (Close / Close N bars ago)
which oscillates around 100 instead of zero (above 100 = up, below = down). MetaTrader’s built-in Momentum uses this ratio form, so don’t be surprised if your platform centers on 100 rather than 0 — same information, shifted scale.
Momentum vs Rate of Change
They are the same idea with one difference:
- Momentum = the absolute change:
Close − Close[n]. - ROC = the percentage change:
100 × (Close − Close[n]) / Close[n].
ROC’s percentage is comparable across instruments and price levels; Momentum’s raw points are not (10 points means something different on a $20 stock than a $2,000 one). If you only ever learn one, learn ROC — but Momentum is the more literal primitive, and it’s what a lot of platforms label simply “Momentum.”
How to read it
Zero-line (or 100-line) cross. Crossing above zero (or 100) means price is now higher than N bars ago — momentum turning up. The basic signal.
Extremes. A large positive or negative Momentum means an unusually fast move, often overextended. Like ROC, Momentum has no fixed overbought/oversold levels — “extreme” is relative to the instrument’s recent range.
Divergence. Price makes a new high but Momentum makes a lower high → the new high carried less thrust. Same idea as everywhere else.
Slope and acceleration. Rising Momentum means price is pulling away from its past faster; falling Momentum means the move is decelerating even if price still rises.
The settings
10 and 12 are common; 14 too. Shorter is twitchier, longer smoother. Nothing sacred — test for your timeframe.
Where it lies to you
- Absolute units. Not comparable across instruments; if you’re screening many markets, use ROC instead.
- No fixed levels. Unbounded, so overbought/oversold is eyeballed or done with bands — not a fixed threshold.
- Noisy. No smoothing; many traders add a short moving average.
- Drop-off effect. A big bar leaving the window N bars later shifts Momentum on its own, unrelated to today’s action.
The Momentum indicator is the atom of momentum analysis — the thing every fancier oscillator is built from. It’s almost too simple to be interesting on its own, which is exactly why understanding it makes all the others click.
Two meanings of “momentum”
Worth keeping straight, because the word does double duty. The Momentum indicator here is time-series momentum: one instrument versus its own past. Separately, traders and academics talk about cross-sectional momentum — ranking many instruments by recent performance and buying the leaders, selling the laggards. They share the same intuition (“recent strength persists”) but are different tools: one is a line on a single chart, the other a ranking across a universe. This indicator is the former; the history traces how the latter became a documented market factor.
Now go test it, don’t trust it
Does a Momentum zero-cross (or a smoothed version) add anything on your market? Quick to test. Build it in AlgoGen and see. Then build Momentum yourself in Python, MQL5, Pine Script, EasyLanguage, or NinjaScript.
This post is educational, not financial advice. Indicators describe the past; they don’t predict the future. Backtest anything before you risk real money on it.