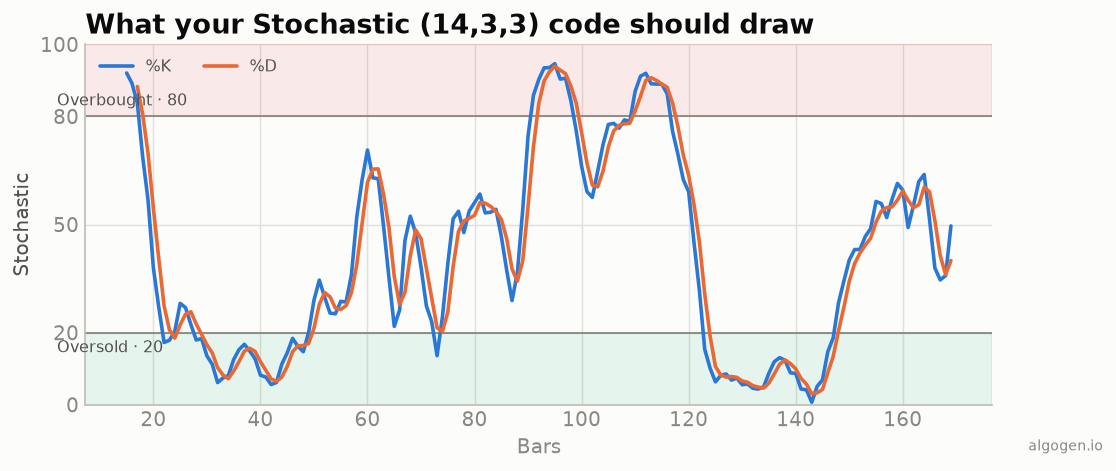
Pine Script has ta.stoch for the raw %K, and building the slow stochastic on
top of it is two ta.sma calls. Here’s the version from
the explainer, zones and all.
What you’ll need
- A TradingView account (free tier is fine)
- The Pine Editor
The source
//@version=5
indicator("AlgoGen Stochastic", shorttitle="AG Stoch", overlay=false)

kLen   = input.int(14, "%K length")
smooth = input.int(3,  "%K smoothing")
dLen   = input.int(3,  "%D length")

rawK = ta.stoch(close, high, low, kLen)   // 100 * (close - LL) / (HH - LL)
k    = ta.sma(rawK, smooth)               // slow %K
d    = ta.sma(k, dLen)                     // %D

plot(k, "%K", color=#2a78d6, linewidth=2)
plot(d, "%D", color=#eb6834, linewidth=2)

h80 = hline(80, "Overbought", color=color.gray)
h20 = hline(20, "Oversold",   color=color.gray)
fill(h80, hline(100), color=color.new(#e34948, 90))
fill(hline(0), h20,   color=color.new(#1baf7a, 90))
ta.stoch(close, high, low, kLen) gives raw %K directly — note the argument order
(source, high, low). Smoothing it once yields the slow %K, and averaging that
gives %D. The fill calls shade the overbought/oversold zones like the output
chart.
Cross alerts
alertcondition(ta.crossover(k, d)  and k < 20, "Stoch bull", "%K crossed up in oversold")
alertcondition(ta.crossunder(k, d) and k > 80, "Stoch bear", "%K crossed down in overbought")
Colouring the momentum zones
A nice touch is tinting the %K line itself when it’s in an extreme, so the state reads at a glance without hunting for the level lines:
kColor = k > 80 ? #e34948 : k < 20 ? #1baf7a : #2a78d6
plot(k, "%K", color=kColor, linewidth=2)
Blue in the neutral zone, red when overbought, green when oversold — the colour is redundant with position (never the only signal), which keeps it readable for colour-blind viewers too.
Adding it
- Paste and Add to chart — it opens in its own pane.
- For the raw fast stochastic, plot
rawKandta.sma(rawK, dLen)instead. - Right-click → Add alert to wire up the cross conditions above.
Gotchas
- Argument order.
ta.stochtakes(source, high, low, length). Swapping high and low silently gives nonsense. - Slow vs fast. The extra
ta.sma(rawK, smooth)is the only difference. “14, 3, 3” is the slow version. - Divide-by-zero.
ta.stochhandles a flat range internally, so you won’t getinf— but be aware the value can flatline in a dead range.
Same indicator elsewhere: Python, MQL5, EasyLanguage, NinjaScript. Then test a stochastic rule in AlgoGen.
This post is educational, not financial advice. Indicators describe the past; they don’t predict the future. Backtest anything before you risk real money on it.
Sources and further reading
- The Origins of the Stochastic Oscillator (CMT Association)
- Pine Script built-ins (TradingView)