Given that the stochastic grew up on the Chicago trading floors that also shaped systematic futures trading, it’s fitting that EasyLanguage handles it cleanly. Here’s the slow stochastic from the explainer, both via the built-in function and from scratch.
What you’ll need
- TradeStation or MultiCharts
- The EasyLanguage / PowerLanguage Editor, new Indicator
The built-in version
EasyLanguage’s Stochastic function fills variables passed by reference with the
fast and slow lines in one call:
{ AlgoGen Stochastic — TradeStation / MultiCharts }
inputs:
    KLen( 14 ),
    KSmooth( 3 ),
    DLen( 3 );

variables:
    oFastK( 0 ), oFastD( 0 ), oSlowK( 0 ), oSlowD( 0 );

Value1 = Stochastic( High, Low, Close, KLen, KSmooth, DLen, 1,
                     oFastK, oFastD, oSlowK, oSlowD );

Plot1( oSlowK, "%K" );
Plot2( oSlowD, "%D" );
Plot3( 80, "OB" );
Plot4( 20, "OS" );
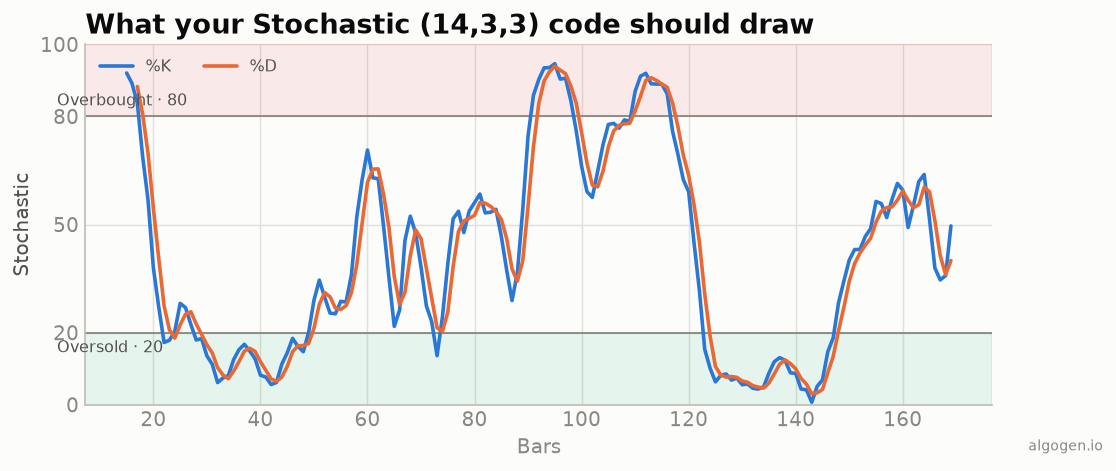
The function writes oSlowK and oSlowD — the slow %K and %D — which we plot as
the blue and orange lines from the output chart.
The from-scratch version
To see exactly what it’s doing:
{ AlgoGen Stochastic (manual) }
inputs: KLen( 14 ), KSmooth( 3 ), DLen( 3 );
variables: LL( 0 ), HH( 0 ), Rng( 0 ), RawK( 0 ), SlowK( 0 ), SlowD( 0 );

LL  = Lowest( Low, KLen );
HH  = Highest( High, KLen );
Rng = HH - LL;
if Rng = 0 then RawK = 50 else RawK = 100 * ( Close - LL ) / Rng;

SlowK = Average( RawK, KSmooth );   { slow %K }
SlowD = Average( SlowK, DLen );      { %D }

Plot1( SlowK, "%K" );
Plot2( SlowD, "%D" );
Verify & apply
- Paste, press F3 to verify, apply in a sub-graph.
- Confirm your %K/%D match the output chart’s crossing points.
Gotchas
Rng = 0guard.Lowest/Highestcan be equal on a flat window; the guard substitutes a neutral 50 instead of dividing by zero.- Built-in signature. The
Stochasticfunction returns all four lines by reference — fast and slow — plus a return value; assign that to a dummy (Value1). Read the slow outputs for the standard 14,3,3. Averageis the SMA. The stochastic smoothing is simple, not exponential — useAverage, notXAverage.
Same indicator elsewhere: Python, MQL5, Pine Script, NinjaScript. Then backtest it in AlgoGen.
This post is educational, not financial advice. Indicators describe the past; they don’t predict the future. Backtest anything before you risk real money on it.
Sources and further reading
- The Origins of the Stochastic Oscillator (CMT Association)
- What is EasyLanguage? (TradeStation)