Pine has ta.stdev for standard deviation, and — refreshingly — it defaults to the
population version, which is the one you want for an indicator. So the canonical
version is one line. See the explainer.
What you’ll need
- A TradingView account (free tier is fine)
- The Pine Editor
The source
//@version=5
indicator("AlgoGen Standard Deviation", shorttitle="AG StdDev", overlay=false)

length = input.int(20, "Length")
sd = ta.stdev(close, length)      // population std (biased=true by default)

plot(sd, "StdDev", color=#eb6834, linewidth=2)
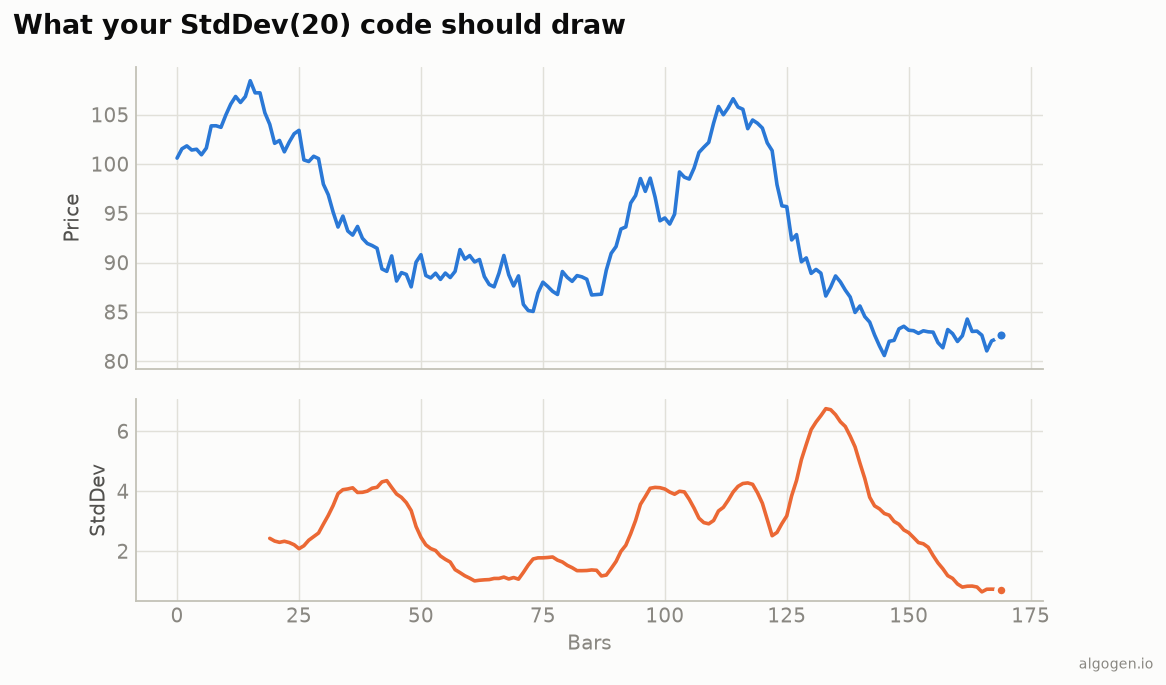
ta.stdev(close, length) returns the rolling population standard deviation — the
orange line on the output chart, rising when price scatters and falling when it settles.
The biased flag (Pine’s version of the ddof trap)
ta.stdev has an optional third argument:
ta.stdev(close, length)              // biased=true  → population (divide by N)  ✓ default
ta.stdev(close, length, false)       // biased=false → sample     (divide by N-1)
Leave it at the default (biased=true). That’s the population version Bollinger
Bands use. Passing false gives you the sample std, which comes out slightly larger and
won’t match your bands. Every language has this trap; in Pine it’s this one boolean.
From scratch
To see the machinery (and prove ta.stdev does what you think):
//@version=5
indicator("AlgoGen StdDev (manual)", overlay=false)
length = input.int(20, "Length")
mean = ta.sma(close, length)
variance = math.sum(math.pow(close - mean, 2), length) / length   // divide by N
sdManual = math.sqrt(variance)
plot(sdManual, color=#eb6834, linewidth=2)
Mean, average squared deviation (dividing by length, i.e. N), square root. This
reproduces ta.stdev with biased=true.
Bollinger Bands, since you’re here
basis = ta.sma(close, 20)
dev   = 2 * ta.stdev(close, 20)
plot(basis, "Basis", color=#4a3aa7)
plot(basis + dev, "Upper", color=#2a78d6)
plot(basis - dev, "Lower", color=#2a78d6)
A moving average plus/minus two population standard deviations — the whole Bollinger definition, built on the line above.
Gotchas
- Keep
biased=true. The default is the population version; don’t passfalseunless you specifically want sample std. - Non-directional, price units. StdDev says nothing about up vs down, and its scale depends on the instrument’s price — normalize to compare across symbols.
overlay=false. It’s a magnitude, so plot it in a separate pane.
Same indicator elsewhere: Python, MQL5, EasyLanguage, NinjaScript. Then test a volatility filter in AlgoGen.
This post is educational, not financial advice. Indicators describe the past; they don’t predict the future. Backtest anything before you risk real money on it.
Sources and further reading
- Pine Script built-ins (TradingView)