NinjaTrader 8 ships a StdDev indicator you can call from any script, and its
population-vs-sample behaviour is worth pinning down before you build on it. See
the explainer.
What you’ll need
- NinjaTrader 8 and the NinjaScript Editor (New → Indicator)
The built-in
// Anywhere in OnBarUpdate:
double sd = StdDev(20)[0];   // 20-period standard deviation of Close
NinjaTrader’s StdDev computes the population standard deviation (divide by N) by
default, matching Bollinger Bands. That’s what you want.
From scratch
To own the math and prove what the built-in does:
public class AlgoGenStdDev : Indicator
{
    private int period = 20;

    protected override void OnStateChange()
    {
        if (State == State.SetDefaults)
        {
            Name = "AlgoGen StdDev";
            IsOverlay = false;
            AddPlot(Brushes.DarkOrange, "StdDev");
        }
        else if (State == State.Configure)
        {
            // nothing extra needed
        }
    }

    protected override void OnBarUpdate()
    {
        if (CurrentBar < period - 1)
            return;

        // 1. mean of the last N closes
        double sum = 0;
        for (int k = 0; k < period; k++)
            sum += Close[k];
        double mean = sum / period;

        // 2. average squared deviation (population: divide by N)
        double sq = 0;
        for (int k = 0; k < period; k++)
        {
            double d = Close[k] - mean;
            sq += d * d;
        }
        Value[0] = Math.Sqrt(sq / period);   // <-- N, not N-1
    }

    [NinjaScriptProperty]
    [Range(1, int.MaxValue)]
    [Display(Name = "Period", GroupName = "Parameters", Order = 0)]
    public int Period
    {
        get { return period; }
        set { period = Math.Max(1, value); }
    }
}
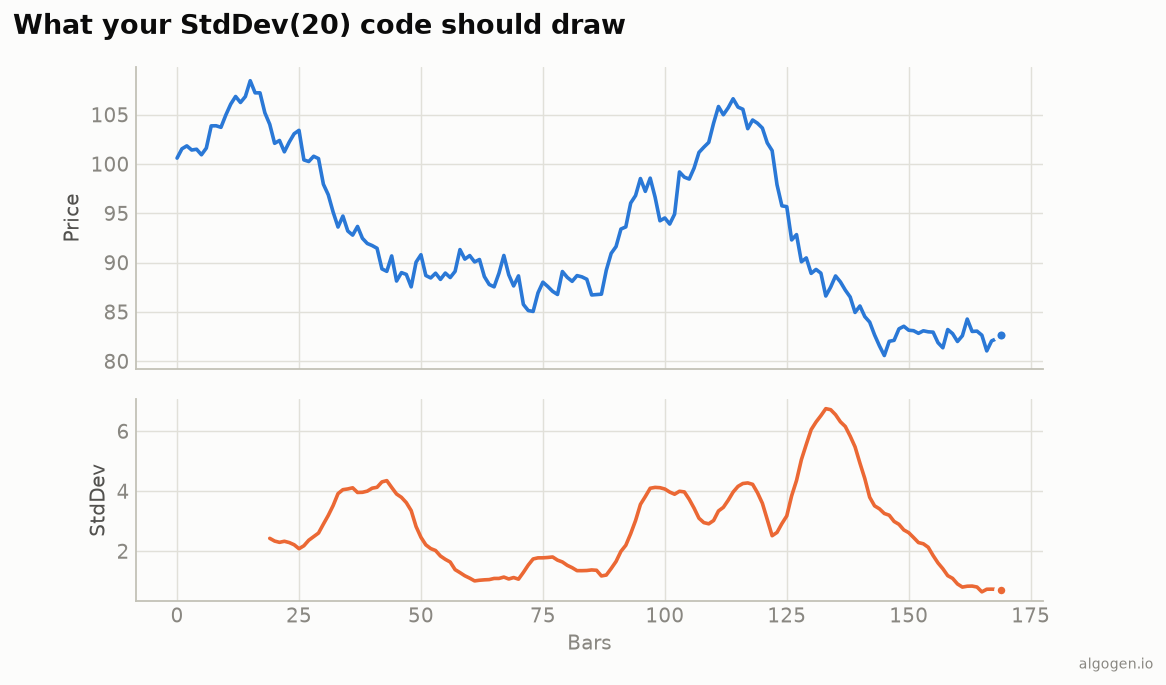
Close[k] indexes back k bars, so the loops walk the last period closes: mean first,
then the average squared distance from it (divided by N), then the square root — the
orange line on the output chart.
Bollinger Bands from it
double basis = SMA(20)[0];
double dev   = 2 * StdDev(20)[0];
double upper = basis + dev;
double lower = basis - dev;
A moving average plus/minus two population standard deviations — Bollinger Bands, built on the same primitive.
Gotchas
- Divide by N. The from-scratch loop uses population std to match the built-in and Bollinger Bands; don’t switch it to N−1.
- Warm-up guard.
if (CurrentBar < period - 1) return;avoids reading bars that don’t exist yet. IsOverlay = false. It’s a magnitude in price units — draw it in a panel below price.
Same indicator elsewhere: Python, MQL5, Pine Script, EasyLanguage. Then test a volatility-gated rule in AlgoGen.
This post is educational, not financial advice. Indicators describe the past; they don’t predict the future. Backtest anything before you risk real money on it.
Sources and further reading
- NinjaScript system indicator methods (NinjaTrader)