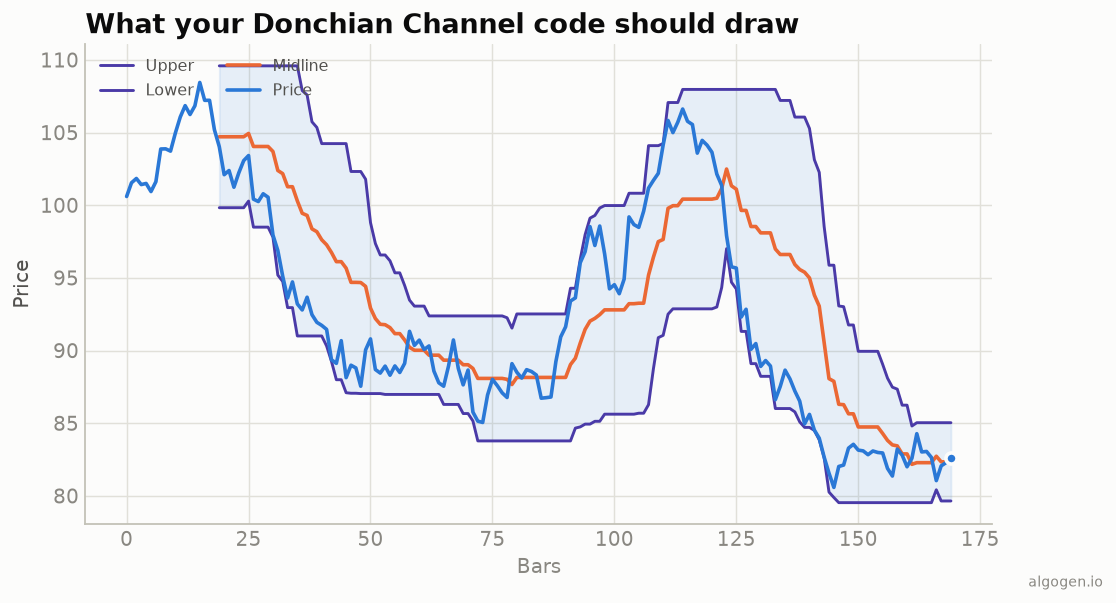
Donchian Channels in Pine are two built-in calls plus a fill. We’ll plot the channel, mark breakouts (with the correct prior-bar shift), and sketch a Turtle-style strategy. See the explainer.
What you’ll need
- A TradingView account (free tier is fine)
- The Pine Editor
The source
//@version=5
indicator("AlgoGen Donchian", shorttitle="AG DC", overlay=true)

length = input.int(20, "Length", minval=1)

upper = ta.highest(high, length)
lower = ta.lowest(low, length)
mid   = (upper + lower) / 2

pU = plot(upper, "Upper", color=#4a3aa7)
pL = plot(lower, "Lower", color=#4a3aa7)
plot(mid, "Middle", color=#eb6834, linewidth=2)
fill(pU, pL, color=color.new(#2a78d6, 92))

// Breakout markers use the PRIOR bar's channel (upper[1]/lower[1]).
breakUp = close > upper[1]
breakDn = close < lower[1]
plotshape(breakUp, "Break up",   shape.triangleup,   location.belowbar, color=#0ca30c, size=size.tiny)
plotshape(breakDn, "Break down", shape.triangledown, location.abovebar, color=#d03b3b, size=size.tiny)
ta.highest/ta.lowest are the channel; the fill shades it; and the
upper[1]/lower[1] shift is what makes the breakout signals valid — comparing to
the channel before this bar.
A Turtle-style strategy
//@version=5
strategy("AlgoGen Turtle DC", overlay=true)
entryLen = input.int(20, "Entry channel")
exitLen  = input.int(10, "Exit channel")
if close > ta.highest(high, entryLen)[1]
    strategy.entry("Long", strategy.long)
if close < ta.lowest(low, exitLen)[1]
    strategy.close("Long")
Enter on a 20-bar high, exit on a 10-bar low — the asymmetric Turtle logic. Run the Strategy Tester to feel trend-following’s “many small losses, few big wins” shape.
Channel width as a squeeze gauge
A narrowing Donchian channel means a quiet, coiling market — often a precursor to a breakout. Plot the width relative to price to spot it:
widthPct = 100 * (upper - lower) / close
// A fresh contraction: width at a 50-bar low.
squeeze = widthPct <= ta.lowest(widthPct, 50)
bgcolor(squeeze ? color.new(color.gray, 85) : na, title="DC squeeze")
alertcondition(breakUp and squeeze[1], "Break from squeeze", "Broke out of a Donchian squeeze")
Breakouts out of a squeeze are the higher-quality signals; the alert fires only when a break follows a contraction.
Gotchas
[1]on the channel for signals. Without the shift,close > uppercan never be true (today’s high is in today’s channel). Always compare to the prior channel.ta.highest(high, ...)uses highs; deciding between an intrabar break (high/low) and a close-based break changes how many signals you get.- Range whipsaw. Expect false breakouts in sideways markets — filter with a trend gauge if it hurts.
Same indicator elsewhere: Python, MQL5, EasyLanguage, NinjaScript. Then test a breakout system in AlgoGen.
This post is educational, not financial advice. Indicators describe the past; they don’t predict the future. Backtest anything before you risk real money on it.
Sources and further reading
- Pine Script built-ins (TradingView)