EasyLanguage has a built-in StandardDev function, and — like most platforms — it has
a quiet population-vs-sample switch you need to get right. See
the explainer.
What you’ll need
- TradeStation or MultiCharts
- The EasyLanguage / PowerLanguage Editor, a new Indicator
The source
{ AlgoGen Standard Deviation — TradeStation / MultiCharts }
inputs:
    Price( Close ),
    Length( 20 ),
    DataType( 1 );   { 1 = population (divide by N), 2 = sample (divide by N-1) }

variables:
    SD( 0 );

SD = StandardDev( Price, Length, DataType );

Plot1( SD, "StdDev" );
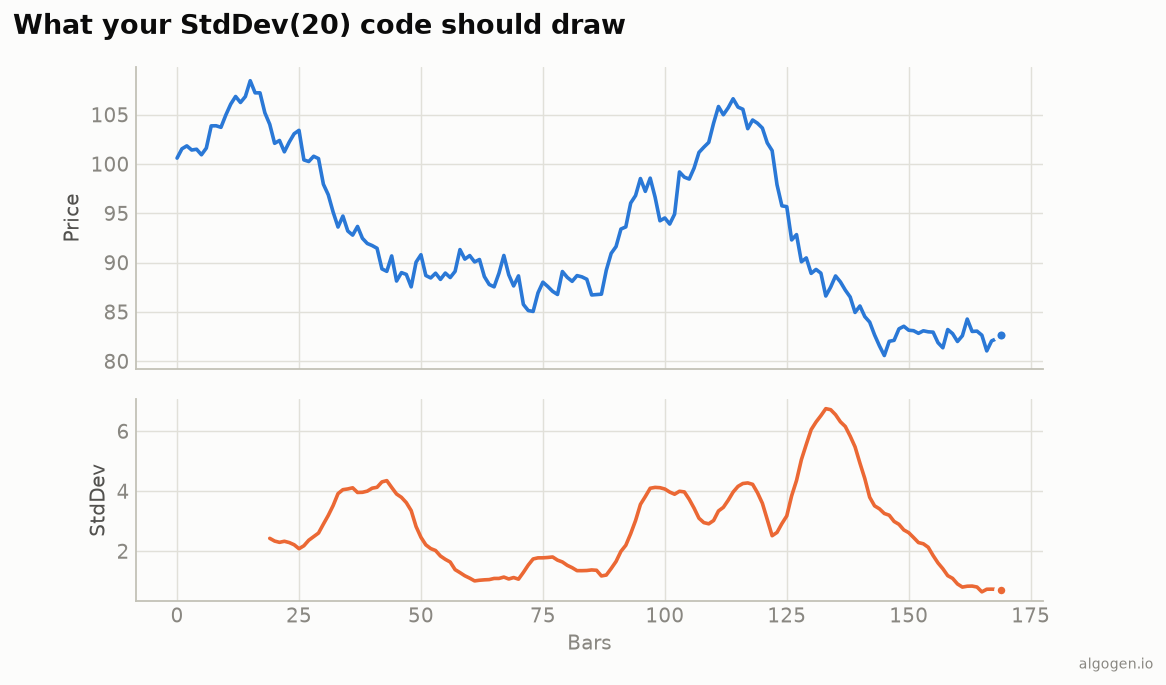
StandardDev( Price, Length, DataType ) returns the rolling standard deviation — the
orange line on the output chart. The third argument is the one that matters.
The DataType argument (the trap)
EasyLanguage’s StandardDev takes a data-type flag:
DataType = 1→ population standard deviation (divide by N). This is what you want — it matches Bollinger Bands and every charting platform.DataType = 2→ sample standard deviation (divide by N−1). Slightly larger; use only if you specifically need the sample estimator.
Every language hides this switch somewhere. In pandas it’s ddof; in Pine it’s
biased; in EasyLanguage it’s this third argument. Default it to 1.
From scratch
To see exactly what the function does:
{ Manual population standard deviation }
inputs: Price( Close ), Length( 20 );
variables: Mean( 0 ), SumSq( 0 ), SD( 0 ), ii( 0 );

Mean = Average( Price, Length );
SumSq = 0;
for ii = 0 to Length - 1 begin
    SumSq = SumSq + Square( Price[ii] - Mean );
end;
SD = SquareRoot( SumSq / Length );   { divide by N for population }

Plot1( SD, "StdDev" );
Average gives the mean, the loop sums the squared deviations, and we divide by
Length (N) before the square root. This matches StandardDev(..., 1).
Gotchas
DataType = 1. Population, not sample. The most common mistake is leaving it at the sample estimator and wondering why bands don’t line up.SquareandSquareRoot. EasyLanguage’s built-in helpers;Square(x)isx*x.- Subgraph placement. It’s a magnitude in price units — plot it in a subgraph below price, not overlaid.
Same indicator elsewhere: Python, MQL5, Pine Script, NinjaScript. Then backtest it in AlgoGen.
This post is educational, not financial advice. Indicators describe the past; they don’t predict the future. Backtest anything before you risk real money on it.
Sources and further reading
- What is EasyLanguage? (TradeStation)