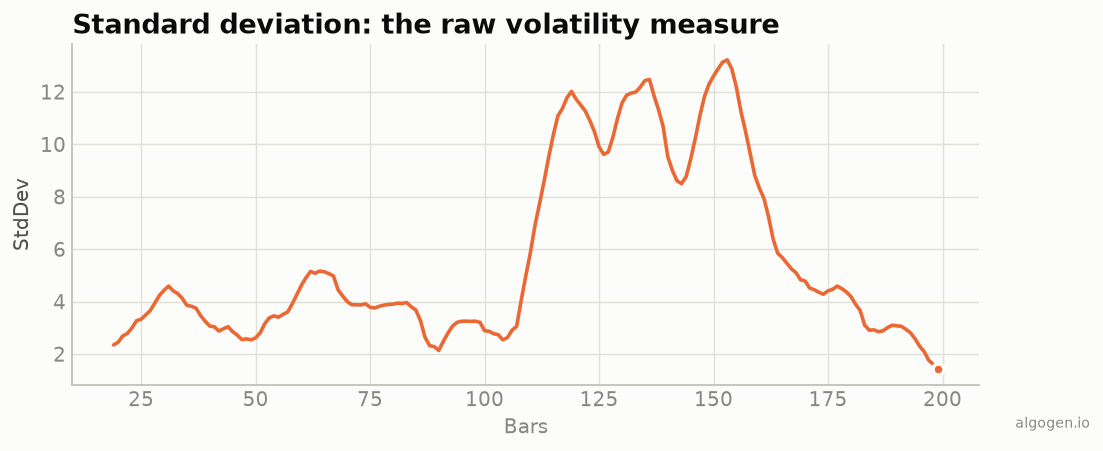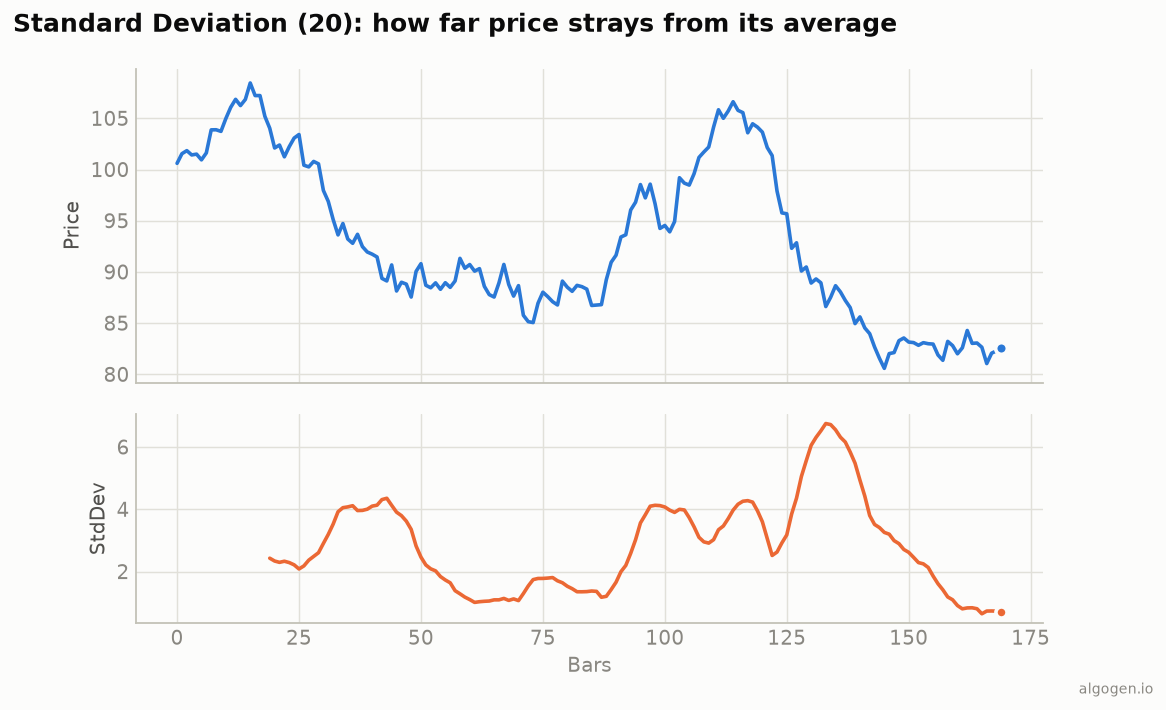
MetaTrader 5 ships a Standard Deviation indicator, and MQL5 exposes it through
iStdDev, so the canonical version is a handle and a copy. The from-scratch version
shows the population-std math. See the explainer.
What you’ll need
- MetaTrader 5 and the MetaEditor
- A new Custom Indicator, plotted in a separate window.
The built-in
int stddevHandle;

int OnInit()
{
    // period, shift, MA method, applied price
    stddevHandle = iStdDev(_Symbol, _Period, 20, 0, MODE_SMA, PRICE_CLOSE);
    return(stddevHandle == INVALID_HANDLE ? INIT_FAILED : INIT_SUCCEEDED);
}
Then copy the buffer in OnCalculate with CopyBuffer(stddevHandle, 0, 0, rates_total, StdDevBuffer). MT5’s iStdDev uses the population formula (divide by N), matching Bollinger Bands.
From scratch
If you want the math in your own hands (and to prove what iStdDev does):
#property indicator_separate_window
#property indicator_buffers 1
#property indicator_plots   1
#property indicator_label1  "StdDev"
#property indicator_type1   DRAW_LINE
#property indicator_color1  clrOrange
#property indicator_width1  2

input int InpPeriod = 20;   // period

double StdDevBuffer[];

int OnInit()
{
    SetIndexBuffer(0, StdDevBuffer, INDICATOR_DATA);
    return(INIT_SUCCEEDED);
}

int OnCalculate(const int rates_total,
                const int prev_calculated,
                const int begin,
                const double &price[])
{
    if(rates_total < InpPeriod) return(0);

    int start = (prev_calculated > 0) ? prev_calculated - 1 : InpPeriod - 1;

    for(int i = start; i < rates_total; i++)
    {
        // 1. mean of the last N prices
        double sum = 0.0;
        for(int k = 0; k < InpPeriod; k++)
            sum += price[i - k];
        double mean = sum / InpPeriod;

        // 2. average squared deviation (population: divide by N)
        double sq = 0.0;
        for(int k = 0; k < InpPeriod; k++)
        {
            double d = price[i - k] - mean;
            sq += d * d;
        }
        StdDevBuffer[i] = MathSqrt(sq / InpPeriod);   // <-- N, not N-1
    }
    return(rates_total);
}
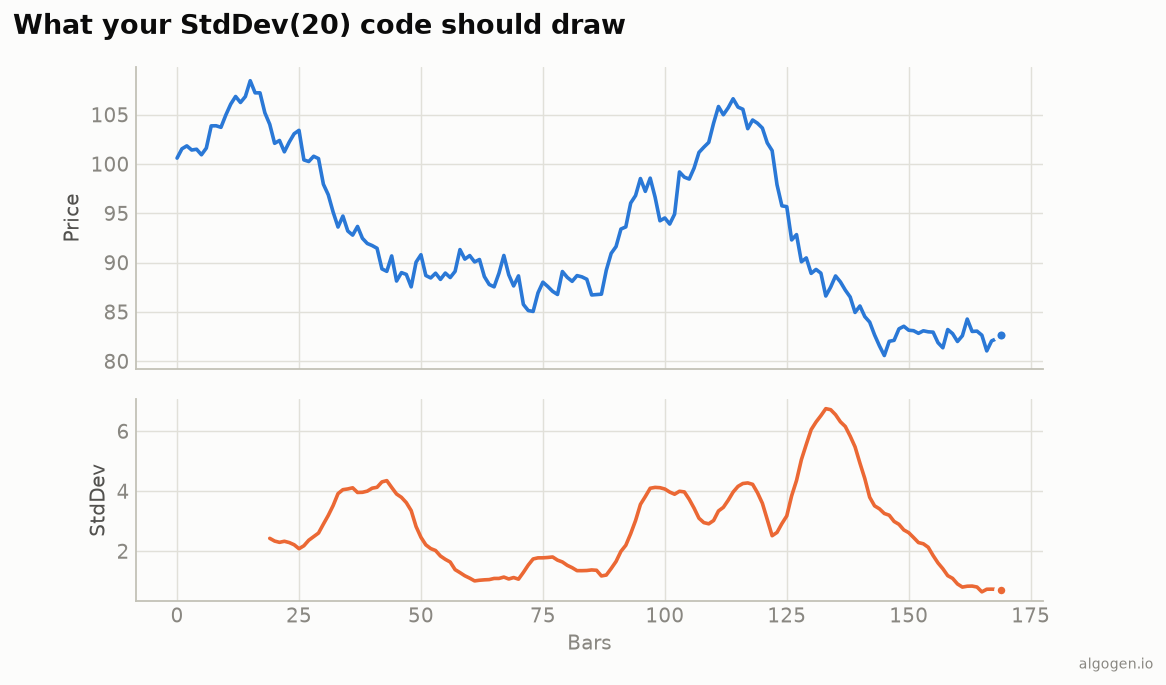
The inner loops compute the mean, then the average of the squared distances from it, then the square root — the same line the built-in draws.
Gotchas
- Divide by N, not N−1.
iStdDevand Bollinger Bands use the population formula. The from-scratch loop above dividessqbyInpPeriod; don’t “fix” it toN-1. applied price. The built-in defaults toPRICE_CLOSE; pass a different applied price if you want std of typical price, etc.MODE_SMA.iStdDevlets you pick the averaging method for the mean; SMA is the standard, and what matches the textbook definition.- Separate window. Standard deviation is in price units but is a magnitude, not a price level — plot it below, not on the chart.
Same indicator elsewhere: Python, Pine Script, EasyLanguage, NinjaScript. Then test it in AlgoGen.
This post is educational, not financial advice. Indicators describe the past; they don’t predict the future. Backtest anything before you risk real money on it.
Sources and further reading
- Technical indicator functions (MetaQuotes)