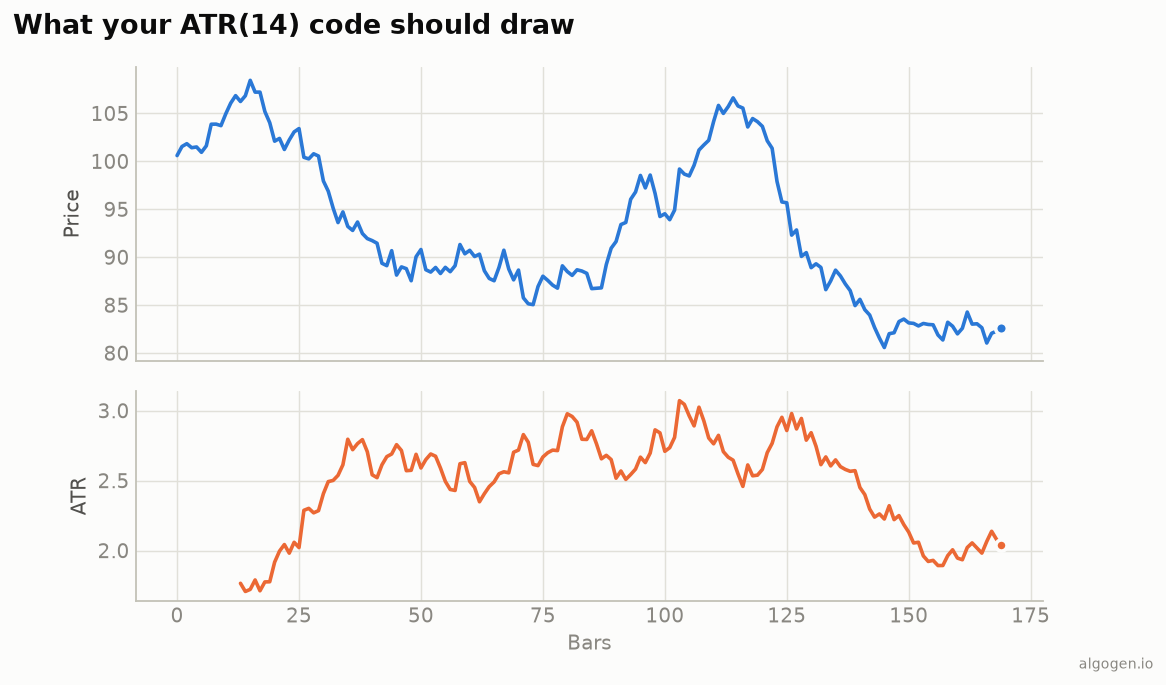
Pine has ta.atr built in, and it’s more interesting to use ATR than just plot
it — so we’ll show the line and then draw ATR-based stop bands on price. See
the explainer for the concept.
What you’ll need
- A TradingView account (free tier is fine)
- The Pine Editor
The ATR line
//@version=5
indicator("AlgoGen ATR", shorttitle="AG ATR", overlay=false)

length = input.int(14, "ATR length", minval=1)
atrVal = ta.atr(length)

plot(atrVal, "ATR", color=#eb6834, linewidth=2)
ta.atr(length) computes True Range internally (including the previous-close gap
terms) and applies Wilder’s smoothing — the orange line from the output chart.
From scratch, to see the True Range
//@version=5
indicator("AlgoGen ATR (manual)", overlay=false)
length = input.int(14, "Length")
tr  = math.max(high - low, math.abs(high - close[1]), math.abs(low - close[1]))
atrManual = ta.rma(tr, length)     // ta.rma == Wilder's smoothing
plot(atrManual, color=#eb6834, linewidth=2)
ta.tr is even shorter (tr = ta.tr(true) handles the first-bar edge case), but
spelling out the three-way max shows exactly what True Range is.
ATR stop bands on price
The genuinely useful application — a volatility-scaled trailing reference:
//@version=5
indicator("AlgoGen ATR Stops", overlay=true)
length = input.int(14, "ATR length")
mult   = input.float(3.0, "Multiplier")
atrVal = ta.atr(length)
longStop  = close - mult * atrVal
shortStop = close + mult * atrVal
plot(longStop,  "Long stop",  color=#0ca30c)
plot(shortStop, "Short stop", color=#d03b3b)
ATR as a percentage (for screening)
Because ATR is in price units, comparing it across instruments is meaningless until you normalize. ATR% fixes that:
//@version=5
indicator("AlgoGen ATR %")
length = input.int(14, "Length")
atrPct = 100 * ta.atr(length) / close
plot(atrPct, "ATR %", color=#eb6834, linewidth=2)
Now a reading of “2” means “the average bar moves about 2% of price,” directly comparable between a $20 stock and a $2,000 one — handy for volatility screens and for setting percentage-based stops.
Gotchas
ta.rma, notta.sma. Wilder’s ATR usesrma(his1/Nsmoothing). Usingta.sma(tr, length)gives a valid-but-different simple ATR that won’t match most platforms.close[1]on the first bar isna;ta.atr/ta.tr(true)handle this for you, but a fully manual version should guard bar 0.- ATR is unbounded. Keep it in its own pane (the line) or use it to derive overlays (the stops) — don’t try to force it onto the 0–100 scale of an oscillator.
Same indicator elsewhere: Python, MQL5, EasyLanguage, NinjaScript. Then test ATR stops in AlgoGen.
This post is educational, not financial advice. Indicators describe the past; they don’t predict the future. Backtest anything before you risk real money on it.
Sources and further reading
- New Concepts in Technical Trading Systems (Windsor Books)
- Pine Script built-ins (TradingView)