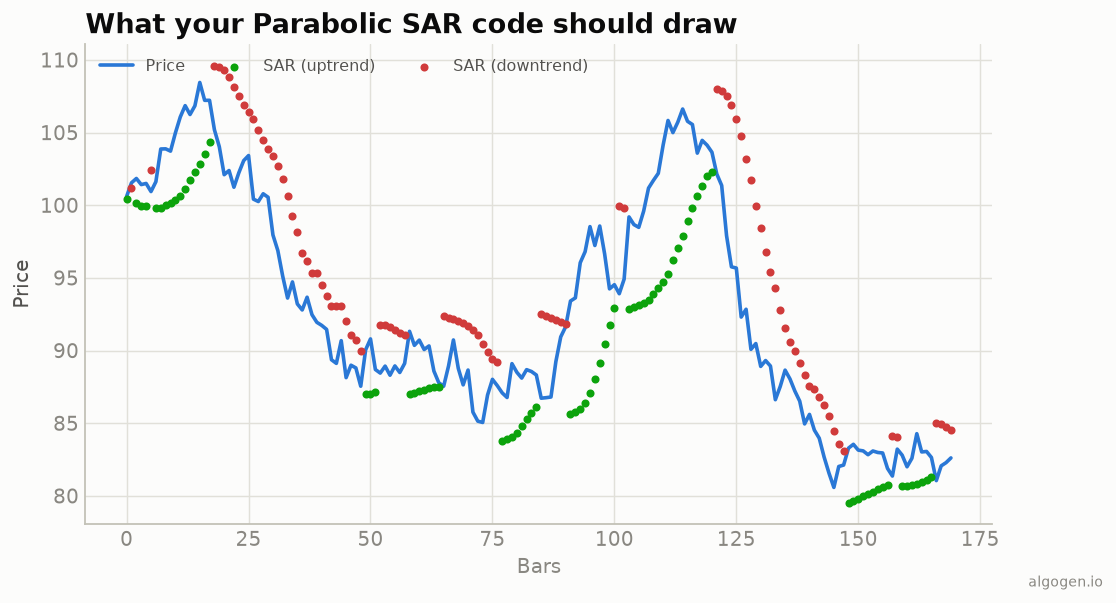
EasyLanguage ships Wilder’s Parabolic SAR, which is welcome given how fiddly the recursive flip logic is to reproduce (see the explainer). Here’s the study and a stop-and-reverse strategy.
What you’ll need
- TradeStation or MultiCharts
- The EasyLanguage / PowerLanguage Editor, new Indicator
The source
TradeStation exposes the Parabolic SAR via the Parabolic reserved function, which
fills variables by reference:
{ AlgoGen Parabolic SAR — TradeStation / MultiCharts }
inputs:
    AfStep( 0.02 ),
    AfMax( 0.20 );

variables:
    oParClose( 0 ),   { SAR value }
    oParOpen( 0 ),
    oPosition( 0 ),   { +1 long side, -1 short side }
    oTransition( 0 );

Value1 = Parabolic( AfStep, AfStep, AfMax, oParClose, oParOpen, oPosition, oTransition );

Plot1( oParClose, "SAR" );
Parabolic returns the SAR level in oParClose and the current side in
oPosition — plot the SAR as dots (set the plot style to point/circles) to get the
trailing dots from the output chart. (Simpler builds also expose a ParabolicSAR
function returning just the value.)
A stop-and-reverse strategy
{ AlgoGen SAR System — Strategy }
inputs: AfStep( 0.02 ), AfMax( 0.20 );
variables: SARval( 0 );

SARval = ParabolicSAR( AfStep, AfMax );

if SARval < Close and SARval[1] >= Close[1] then
    Buy next bar at market
else if SARval > Close and SARval[1] <= Close[1] then
    SellShort next bar at market;
This reverses each time the SAR crosses price — the always-in behavior Wilder intended. Run the Strategy Performance Report, and consider adding an ADX filter to sit out the chop.
Gotchas
- Reference outputs. The full
Parabolicfunction returns several values by reference (SAR, position, transition); assign the function’s return to a dummy (Value1) and read the ones you need. - Plot as dots. Set the plot type to points so it reads as the classic SAR, not a continuous line.
- Always in the market. The pure system is never flat — filter it if your market ranges a lot.
- As a trailing stop only. If you enter on another signal, use the SAR purely to
trail the exit: while long,
Sell next bar at marketwhenClose < SARval. This sidesteps the two-sided whipsaw of trading every flip. SetStopLoss/ attach it. You can also feed the SAR level into a stop order so the platform manages the ratcheting exit for you, rather than checking it bar by bar.
Same indicator elsewhere: Python, MQL5, Pine Script, NinjaScript. Then backtest it in AlgoGen.
This post is educational, not financial advice. Indicators describe the past; they don’t predict the future. Backtest anything before you risk real money on it.
Sources and further reading
- What is EasyLanguage? (TradeStation)