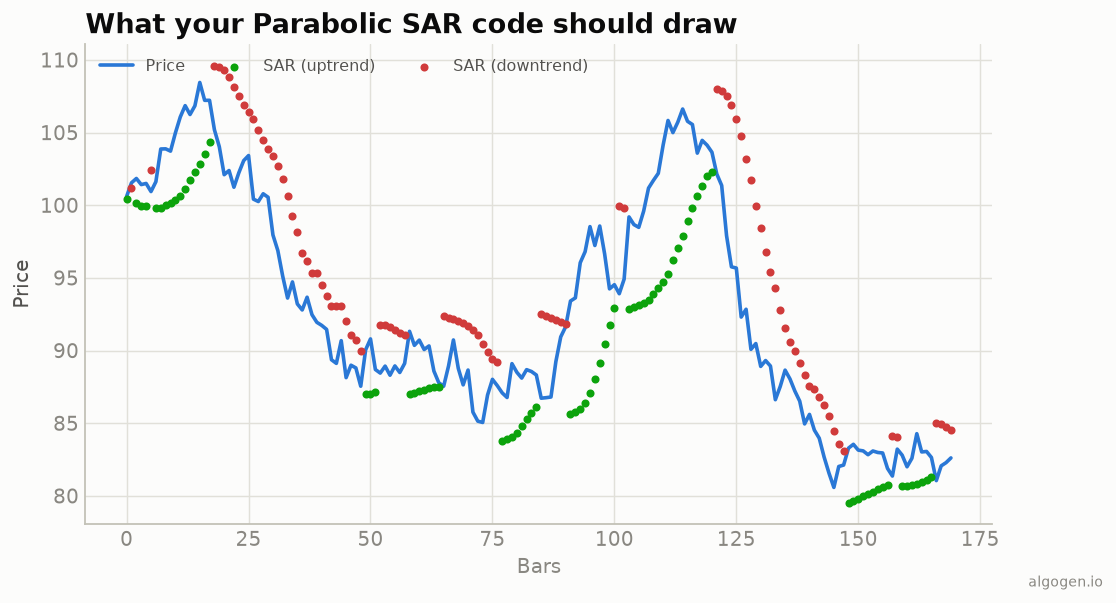
Pine has ta.sar built in, so plotting Wilder’s dots from
the explainer is a one-liner. We’ll colour them
by side and add flip markers.
What you’ll need
- A TradingView account (free tier is fine)
- The Pine Editor
The source
//@version=5
indicator("AlgoGen Parabolic SAR", shorttitle="AG SAR", overlay=true)

start = input.float(0.02, "Start")
inc   = input.float(0.02, "Increment")
maxv  = input.float(0.20, "Max")

sarVal = ta.sar(start, inc, maxv)

// Colour the dots by which side of price they're on.
dotColor = sarVal < close ? #0ca30c : #d03b3b
plot(sarVal, "SAR", style=plot.style_circles, color=dotColor, linewidth=2)

// Flip markers.
flipUp = sarVal < close and sarVal[1] >= close[1]
flipDn = sarVal > close and sarVal[1] <= close[1]
plotshape(flipUp, "Flip up", shape.triangleup,   location.belowbar, color=#0ca30c, size=size.tiny)
plotshape(flipDn, "Flip down", shape.triangledown, location.abovebar, color=#d03b3b, size=size.tiny)
alertcondition(flipUp or flipDn, "SAR flip", "Parabolic SAR flipped")
ta.sar(start, increment, max) returns Wilder’s Parabolic SAR with the standard
0.02 / 0.02 / 0.20 parameters. plot.style_circles draws the classic dots, and the
flipUp/flipDn conditions detect where the SAR crosses to the other side of
price — the stop-and-reverse points from the output chart.
Using it as a strategy / trailing stop
//@version=5
strategy("AlgoGen SAR System", overlay=true)
sarVal = ta.sar(0.02, 0.02, 0.20)
if ta.crossunder(sarVal, close)      // SAR dropped below price -> go long
    strategy.entry("Long", strategy.long)
if ta.crossover(sarVal, close)       // SAR rose above price -> go short
    strategy.entry("Short", strategy.short)
Because the SAR is always-in, this flips between long and short — test it in the Strategy Tester, ideally with a trend filter to skip the range-bound whipsaw.
SAR as a trailing stop only
Many traders don’t trade the flips mechanically — they use the SAR purely to trail an exit on trades entered by some other signal. That’s easy to express:
// Assuming you're long from another signal; exit when price closes below the SAR.
sarVal = ta.sar(0.02, 0.02, 0.20)
longExit = close < sarVal
plotshape(longExit, "Exit long", shape.xcross, location.abovebar, color=#d03b3b, size=size.tiny)
Used this way the SAR is a disciplined, self-tightening stop that never backs up — often its best role, sidestepping the whipsaw of trading every flip in both directions.
Gotchas
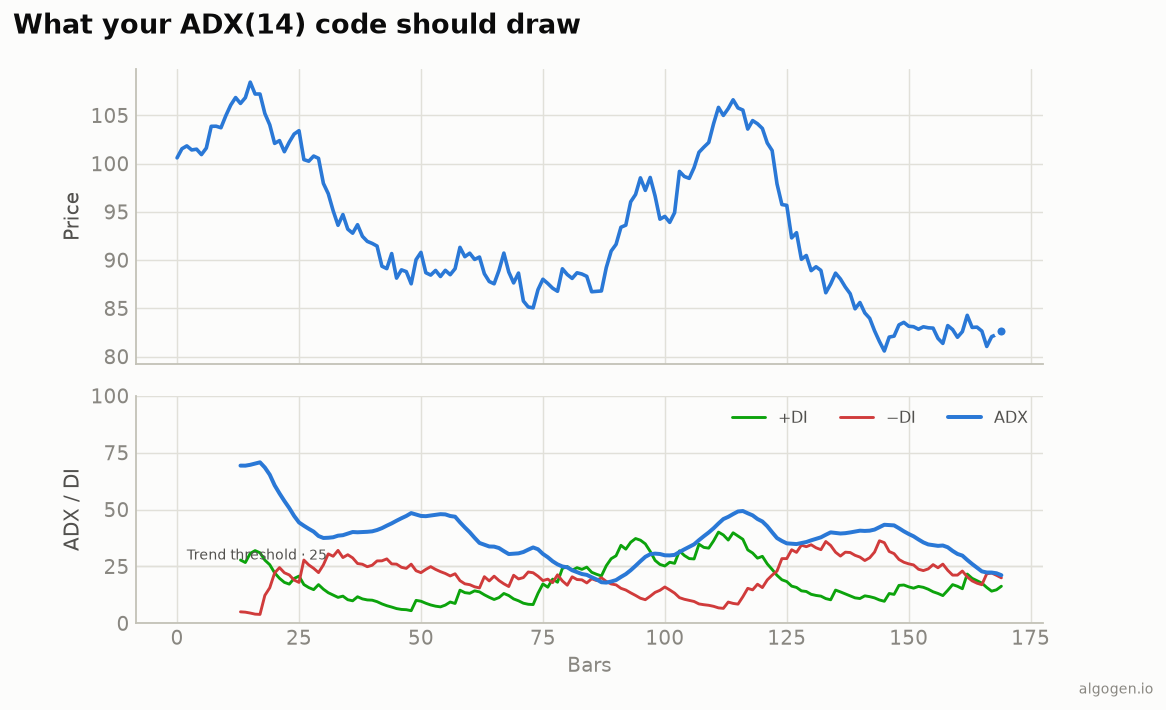
plot.style_circles. That’s what gives the dotted look; a normal line misrepresents the indicator.- Always in the market. The pure system is never flat; consider filtering with the ADX so you only trade flips in real trends.
- Whipsaw awareness. In chop the dots flip every few bars; that’s the indicator, not a bug — it’s why the trend filter matters.
Same indicator elsewhere: Python, MQL5, EasyLanguage, NinjaScript. Then test a SAR system in AlgoGen.
This post is educational, not financial advice. Indicators describe the past; they don’t predict the future. Backtest anything before you risk real money on it.
Sources and further reading
- Pine Script built-ins (TradingView)