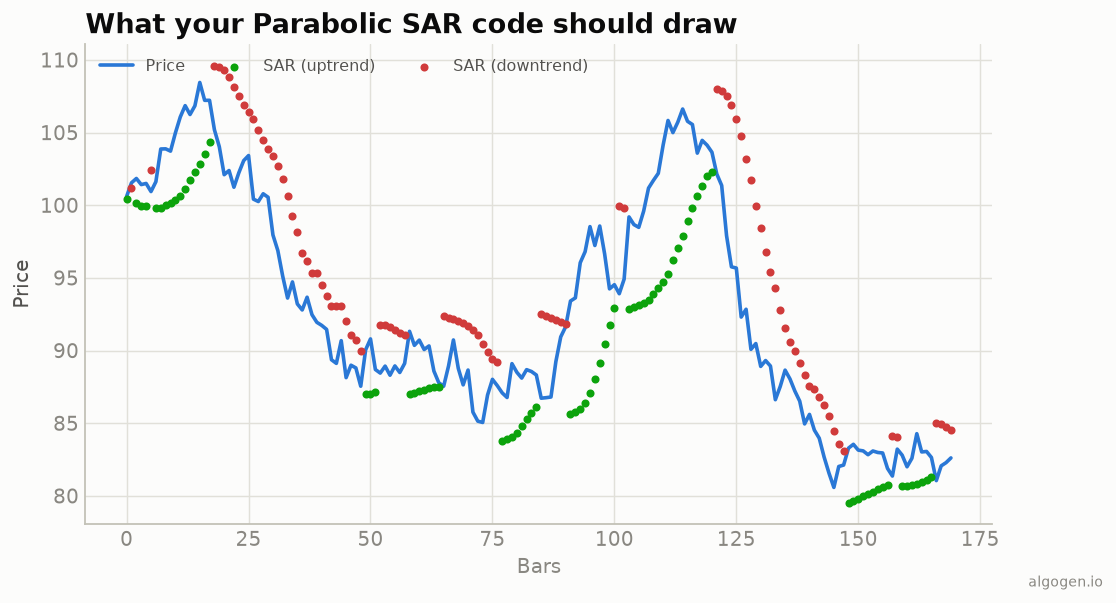
The Parabolic SAR is the most procedural indicator in this series — it’s a genuine state machine, not a vectorized formula. The explainer covers the logic; here it is faithfully in Python, including the constraint most implementations get wrong.
What you’ll need
- Python 3.9+,
numpy high,lowarrays.
From scratch
import numpy as np


def parabolic_sar(high, low, af_start=0.02, af_step=0.02, af_max=0.20):
    high = np.asarray(high, float)
    low = np.asarray(low, float)
    n = len(high)
    sar = np.full(n, np.nan)

    up = True                 # start assuming an uptrend
    af = af_start
    ep = high[0]              # extreme point
    sar[0] = low[0]

    for i in range(1, n):
        prev = sar[i - 1]
        s = prev + af * (ep - prev)

        if up:
            # SAR may not enter the prior two bars' range.
            s = min(s, low[i - 1], low[i - 2] if i >= 2 else low[i - 1])
            if low[i] < s:                 # price hit the stop -> flip down
                up = False
                s = ep                     # new SAR starts at the old extreme
                ep = low[i]
                af = af_start
            elif high[i] > ep:             # new high -> extend and accelerate
                ep = high[i]
                af = min(af + af_step, af_max)
        else:
            s = max(s, high[i - 1], high[i - 2] if i >= 2 else high[i - 1])
            if high[i] > s:                # flip up
                up = True
                s = ep
                ep = high[i]
                af = af_start
            elif low[i] < ep:
                ep = low[i]
                af = min(af + af_step, af_max)

        sar[i] = s

    return sar
Read it as a state machine: track the trend direction, the extreme point, and the acceleration factor; step the SAR toward the EP each bar; flip when price crosses it. That produces the trailing dots from the output chart.
Turning it into signals
sar = parabolic_sar(df["high"].values, df["low"].values)
below = df["close"].values > sar          # dots below price = uptrend
flip_up = np.r_[False, below[1:] & ~below[:-1]]   # flipped to uptrend this bar
flip_dn = np.r_[False, ~below[1:] & below[:-1]]
flip_up/flip_dn mark the bars where the SAR crosses to the other side — the
stop-and-reverse points to backtest in AlgoGen.
Gotchas
- The prior-two-bars constraint.
s = min(s, low[i-1], low[i-2])(and the max for downtrends) stops the SAR from jumping inside recent range. Omitting it is the single most common Parabolic SAR bug. - Flip mechanics. On a flip, the new SAR starts at the old extreme point, and AF resets to the start value. Forgetting the reset makes the next leg trail wrong.
- It’s inherently sequential. Unlike most indicators, you can’t fully vectorize this — the loop is the honest implementation.
The lazy one-liner
import pandas_ta as ta
df["psar"] = ta.psar(df["high"], df["low"], df["close"])["PSARl_0.02_0.2"]
Same indicator elsewhere: MQL5, Pine Script, EasyLanguage, NinjaScript.
This post is educational, not financial advice. Indicators describe the past; they don’t predict the future. Backtest anything before you risk real money on it.
Sources and further reading
- Windowing operations (pandas documentation)