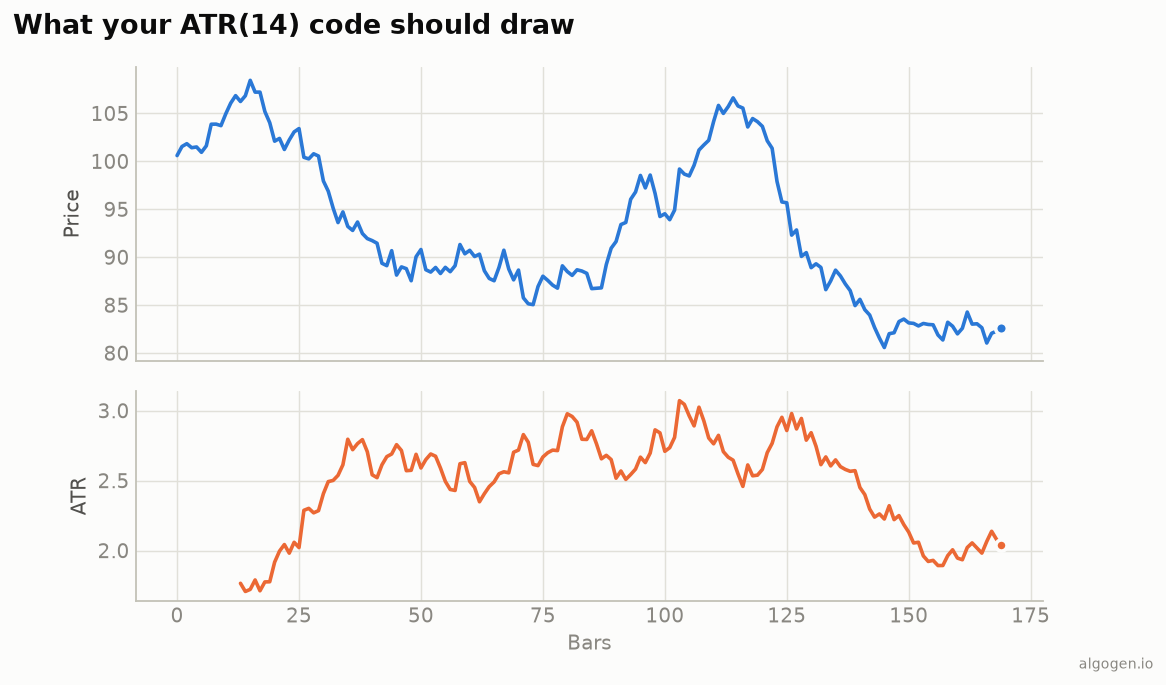
The ATR is two steps: compute True Range, then smooth it Wilder-style. The explainer covers why True Range beats plain high-minus-low; here’s the Python.
What you’ll need
- Python 3.9+,
pandas/numpy high,low,closeseries.
From scratch
import numpy as np
import pandas as pd


def atr(high, low, close, period: int = 14):
    high, low, close = map(lambda s: s.astype(float), (high, low, close))
    prev_close = close.shift(1)

    tr = pd.concat([
        high - low,
        (high - prev_close).abs(),
        (low - prev_close).abs(),
    ], axis=1).max(axis=1)
    tr.iloc[0] = high.iloc[0] - low.iloc[0]     # no prior close on bar 0

    # Wilder's smoothing == EWM with alpha = 1/period, no bias correction.
    return tr.ewm(alpha=1 / period, adjust=False).mean()
The pd.concat(...).max(axis=1) is the three-way max that defines True Range, and
ewm(alpha=1/period, adjust=False) is Wilder’s smoothing — the same trick the
RSI post uses. Feed it OHLC and you get the ATR line from the
chart above.
Turning ATR into a stop and a size
This is what ATR is actually for:
a = atr(df["high"], df["low"], df["close"], 14)

# Volatility-scaled stop distance (e.g. 3x ATR below entry for a long).
stop_distance = 3 * a

# Position size for a fixed dollar risk per trade.
risk_per_trade = 500          # dollars you're willing to lose
shares = risk_per_trade / stop_distance
Now your stop widens in volatile markets and tightens in calm ones automatically, and every trade risks the same amount — the professional way to size. Prove it helps by backtesting it in AlgoGen.
Gotchas
- Bar 0 has no previous close. Seed True Range on the first bar with plain high−low, as above, or you’ll get a NaN or a bogus gap term.
- Wilder smoothing, not SMA. Some “ATR” implementations use a simple average
of True Range. That’s a valid variant but won’t match Wilder’s (and most
platforms’). Use
ewm(alpha=1/period). - Seeding warm-up.
ewm(adjust=False)seeds on the first True Range, whereas many platforms seed with a simple average of the firstperiodTrue Ranges. Both use the same1/periodrecurrence and converge over the warm-up, but can differ in the early bars — the same seeding nuance as the EMA. - Units. ATR is in the instrument’s price units, not a percentage. Normalize (ATR / close) if you’re comparing across instruments.
The lazy one-liner
import pandas_ta as ta
df["atr14"] = ta.atr(df["high"], df["low"], df["close"], length=14)
Same indicator elsewhere: MQL5, Pine Script, EasyLanguage, NinjaScript.
This post is educational, not financial advice. Indicators describe the past; they don’t predict the future. Backtest anything before you risk real money on it.
Sources and further reading
- New Concepts in Technical Trading Systems (Windsor Books)
- Windowing operations (pandas documentation)