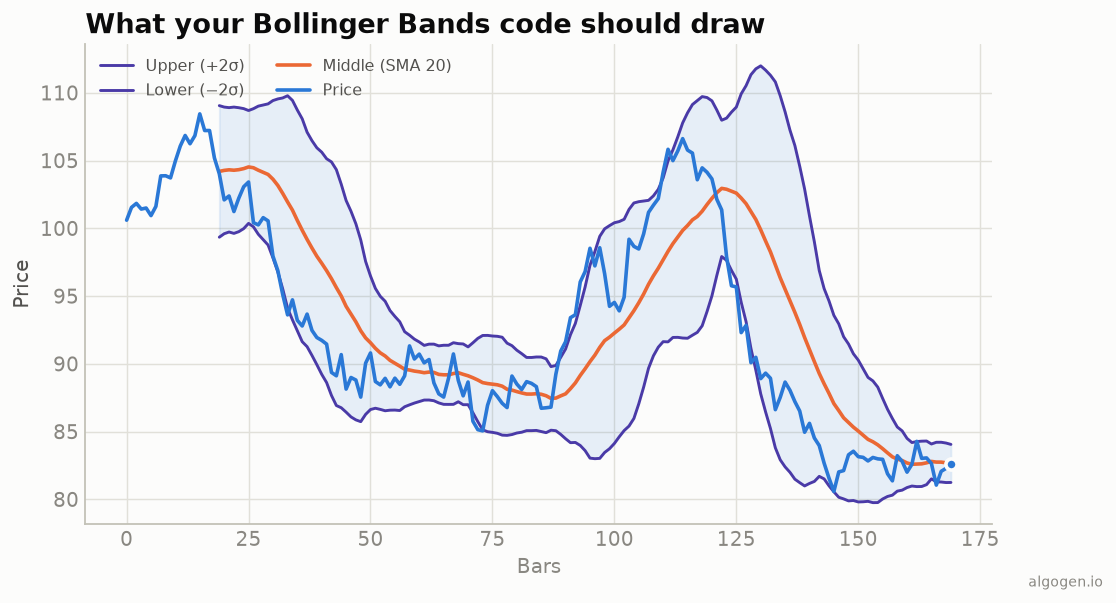
Pine Script has ta.bb built in, so plotting the bands from
the explainer is a couple of lines. We’ll add
the filled channel, a squeeze highlighter, and the %b reading.
What you’ll need
- A TradingView account (free tier is fine)
- The Pine Editor
The source
//@version=5
indicator("AlgoGen Bollinger Bands", shorttitle="AG BB", overlay=true)

length = input.int(20, "Length", minval=1)
mult   = input.float(2.0, "StdDev", minval=0.1, step=0.1)

[mid, upper, lower] = ta.bb(close, length, mult)

p_up  = plot(upper, "Upper", color=#4a3aa7)
p_lo  = plot(lower, "Lower", color=#4a3aa7)
plot(mid, "Middle", color=#eb6834, linewidth=2)
fill(p_up, p_lo, color=color.new(#2a78d6, 92), title="Band fill")

// Squeeze: bandwidth at a 100-bar low.
bandwidth = (upper - lower) / mid
squeeze   = bandwidth <= ta.lowest(bandwidth, 100)
bgcolor(squeeze ? color.new(color.gray, 85) : na, title="Squeeze")
ta.bb returns [middle, upper, lower], and — importantly — it uses the
population standard deviation, matching every other version in this series.
The fill shades the channel; the bgcolor line flags a squeeze whenever
bandwidth hits a 100-bar low.
%b as a separate pane
//@version=5
indicator("AlgoGen %b")
[mid, upper, lower] = ta.bb(close, 20, 2.0)
pctB = (close - lower) / (upper - lower)
plot(pctB, "%b", color=#2a78d6, linewidth=2)
hline(1, "Upper"), hline(0, "Lower"), hline(0.5, "Mid", color=color.gray)
Squeeze breakout alerts
Because the squeeze is the most respected Bollinger signal, here’s how to alert on a breakout out of a squeeze — the volatility contraction followed by price escaping the band:
firedUp   = squeeze[1] and close > upper
firedDown = squeeze[1] and close < lower
alertcondition(firedUp,   "BB squeeze break up",   "Price broke above upper band out of a squeeze")
alertcondition(firedDown, "BB squeeze break down", "Price broke below lower band out of a squeeze")
Note the squeeze[1] — we check that the previous bar was in a squeeze and this
bar broke out, so the signal fires on the expansion, not during the quiet period.
Adding it
- Paste and Add to chart (
overlay=truedraws on price). - Tune length and multiplier together, as the explainer recommends.
- Right-click → Add alert, and pick one of the alert conditions above.
Gotchas
- Population std, handled for you.
ta.bb(andta.stdev) use population standard deviation, so you don’t hit theddoftrap here — but know it’s why Pine matches Python’sddof=0and not its default. - Tuple order.
ta.bbreturns[middle, upper, lower]— middle first. - Squeeze is relative.
ta.lowest(bandwidth, 100)defines “narrow” over the last 100 bars; change the window to change the sensitivity.
Same indicator elsewhere: Python, MQL5, EasyLanguage, NinjaScript. Then test a squeeze breakout in AlgoGen.
This post is educational, not financial advice. Indicators describe the past; they don’t predict the future. Backtest anything before you risk real money on it.
Sources and further reading
- John Bollinger's official Bollinger Bands reference (Bollinger Capital Management)
- Pine Script built-ins (TradingView)