If you read the explainer, you already know the RSI is just averaged gains over averaged losses, bounded to 0–100. So let’s build it — correctly, with Wilder’s smoothing, so it actually matches what your charting platform draws. The version below is verified to reproduce the MQL5, Pine, EasyLanguage and NinjaScript versions in this series to the last decimal.
What you’ll need
- Python 3.9+
numpy(andpandasif you’re loading a CSV)- A
closeprice series.
The from-scratch version
The only subtlety is the smoothing. Wilder’s average is seeded with a simple
average of the first period moves, then each later bar updates the running
average by 1/period. That seeding is the part naive implementations get wrong —
and it’s exactly what TradingView’s ta.rma does under the hood.
import numpy as np


def rsi(close, period: int = 14):
    close = np.asarray(close, dtype=float)
    delta = np.diff(close)                 # bar-to-bar change
    gain = np.clip(delta, 0.0, None)
    loss = np.clip(-delta, 0.0, None)

    avg_gain = np.full(close.shape, np.nan)
    avg_loss = np.full(close.shape, np.nan)

    # Seed at bar `period` with the simple average of the first `period` moves.
    avg_gain[period] = gain[:period].mean()
    avg_loss[period] = loss[:period].mean()

    # Wilder's recursive smoothing (alpha = 1/period) thereafter.
    for i in range(period + 1, len(close)):
        avg_gain[i] = (avg_gain[i - 1] * (period - 1) + gain[i - 1]) / period
        avg_loss[i] = (avg_loss[i - 1] * (period - 1) + loss[i - 1]) / period

    rs = avg_gain / avg_loss
    out = 100.0 - (100.0 / (1.0 + rs))
    out[avg_loss == 0] = 100.0             # all-up window -> RSI pinned at 100
    return out
Use it on any close series:
import pandas as pd
df = pd.read_csv("prices.csv", parse_dates=["date"]).set_index("date")
df["rsi14"] = rsi(df["close"].to_numpy(), 14)
print(df[["close", "rsi14"]].tail())
Reading the output
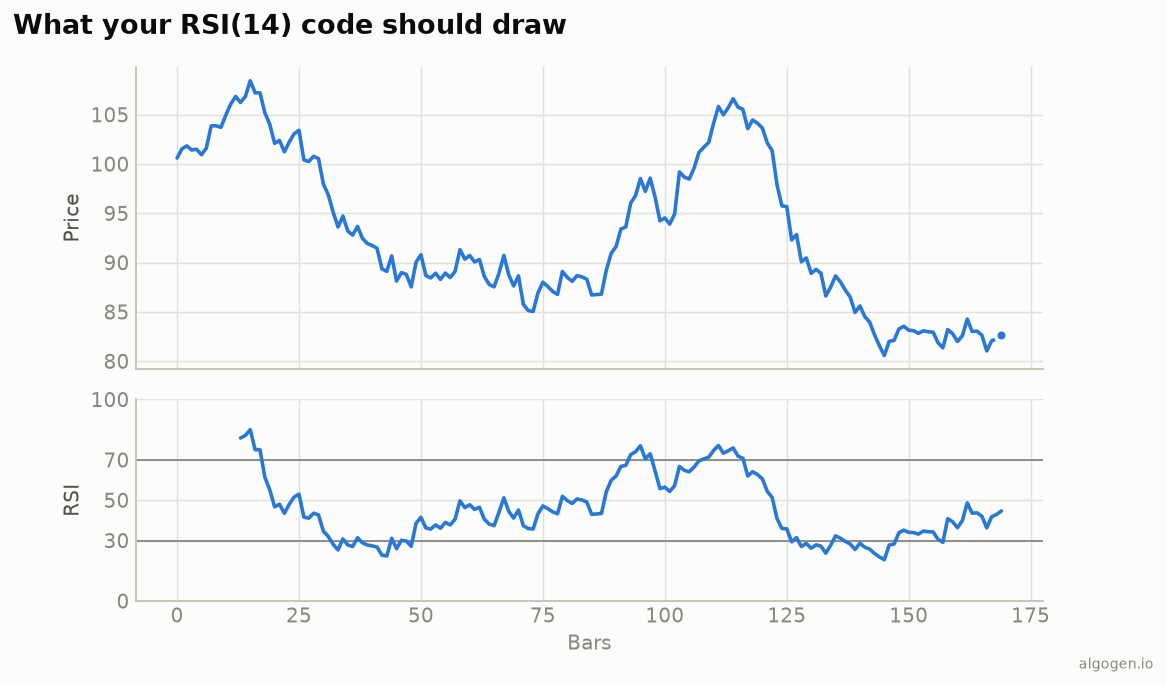
The chart above is exactly what this produces: price on top, the RSI oscillating in its 0–100 box below, tagging the 70 and 30 rails as buying and selling pressure swing. Because it uses Wilder’s SMA-seeded smoothing, the numbers line up with TradingView’s RSI bar-for-bar, not just “roughly.”
Gotchas
- Seeding is everything. The single most common RSI bug is smoothing with a
plain average (or letting an EWM seed itself with the first value). Both drift
several RSI points away from every platform during the warm-up. Seed with the
simple average of the first
periodmoves, as above. - Warm-up is NaN. Bars before index
periodgenuinely have no RSI — leave them NaN, don’t backfill. - The tempting one-liner isn’t exact.
gain.ewm(alpha=1/period, adjust=False).mean()looks clean but seeds on the first observation, so it disagrees with Wilder by up to several points early on before converging. Fine for a rough look; not fine if you need parity.
The lazy (also correct) one-liners
For production, don’t hand-roll it — both of these use proper Wilder smoothing and match the function above:
# pandas-ta
import pandas_ta as ta
df["rsi14"] = ta.rsi(df["close"], length=14)

# TA-Lib (C-backed, fast)
import talib
df["rsi14"] = talib.RSI(df["close"].to_numpy(), timeperiod=14)
Keep the from-scratch version in your head so you always know what the library is doing. Now the real test: don’t trust the line, backtest a rule built on it in AlgoGen. Same indicator elsewhere: MQL5, Pine Script, EasyLanguage, and NinjaScript.
This post is educational, not financial advice. Indicators describe the past; they don’t predict the future. Backtest anything before you risk real money on it.
Sources and further reading
- New Concepts in Technical Trading Systems (Windsor Books)
- Windowing operations (pandas documentation)