EasyLanguage has ATR baked in as AvgTrueRange, which is fitting given how central
volatility-based risk is to the systematic trading EasyLanguage was built for.
See the explainer for the concept.
What you’ll need
- TradeStation or MultiCharts
- The EasyLanguage / PowerLanguage Editor, new Indicator
The built-in version
{ AlgoGen ATR — TradeStation / MultiCharts }
inputs:
    Length( 14 );

variables:
    ATRval( 0 );

ATRval = AvgTrueRange( Length );

Plot1( ATRval, "ATR" );
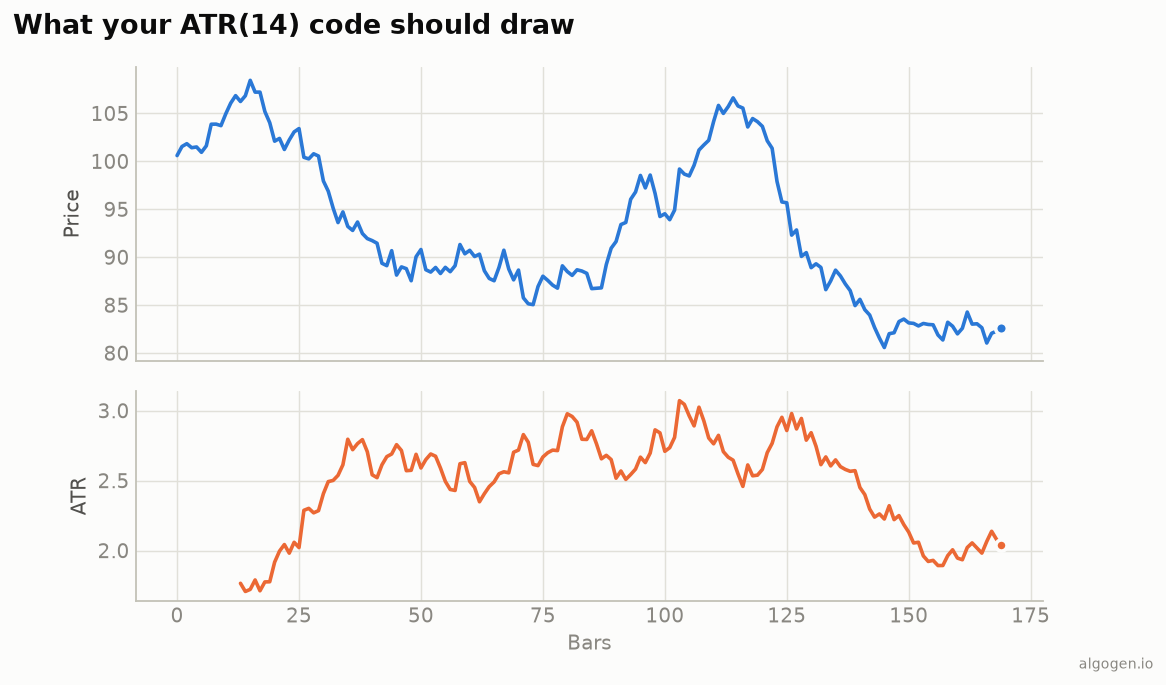
AvgTrueRange( Length ) computes True Range (with the previous-close gap terms)
and applies Wilder’s smoothing — the orange line from the output chart.
TrueRange is also available as its own reserved word if you want the raw,
unsmoothed range.
From scratch
{ AlgoGen ATR (manual) }
inputs: Length( 14 );
variables: TR( 0 ), ATRval( 0 );

TR = MaxList( High - Low,
              AbsValue( High - Close[1] ),
              AbsValue( Low  - Close[1] ) );

if CurrentBar = Length then
    ATRval = Average( TR, Length )                 { seed with a simple average }
else if CurrentBar > Length then
    ATRval = ( ATRval[1] * ( Length - 1 ) + TR ) / Length;   { Wilder }

Plot1( ATRval, "ATR" );
ATR position sizing
The reason ATR earns its keep — turning a fixed dollar risk into a share count:
{ In a Strategy }
inputs: Length( 14 ), DollarRisk( 500 ), ATRmult( 3 );
variables: Shares( 0 );
Shares = DollarRisk / ( ATRmult * AvgTrueRange( Length ) );
{ ... then Buy Shares shares next bar at market, with a 3-ATR stop }
Gotchas
MaxListfor the three-way max. True Range is the max of the range and the two gap terms;MaxListexpresses it cleanly.Close[1]on bar 1 doesn’t exist — theCurrentBarguards handle the warm-up in the manual version.- Wilder smoothing. The recurrence divides the previous ATR’s weight by
Length;AvgTrueRangealready does this, so the built-in and manual versions agree after the seed. TrueRangevsAvgTrueRange.TrueRangeis the raw, unsmoothed range for a single bar;AvgTrueRangeis the smoothed average. Reach for whichever the calculation needs — raw TR for a single-bar volatility check, ATR for stops and sizing.- RadarScreen. ATR% (
AvgTrueRange(Length) / Close * 100) makes a great RadarScreen column for ranking a watchlist by volatility on a comparable scale.
Same indicator elsewhere: Python, MQL5, Pine Script, NinjaScript. Then backtest ATR sizing in AlgoGen.
This post is educational, not financial advice. Indicators describe the past; they don’t predict the future. Backtest anything before you risk real money on it.
Sources and further reading
- New Concepts in Technical Trading Systems (Windsor Books)
- What is EasyLanguage? (TradeStation)