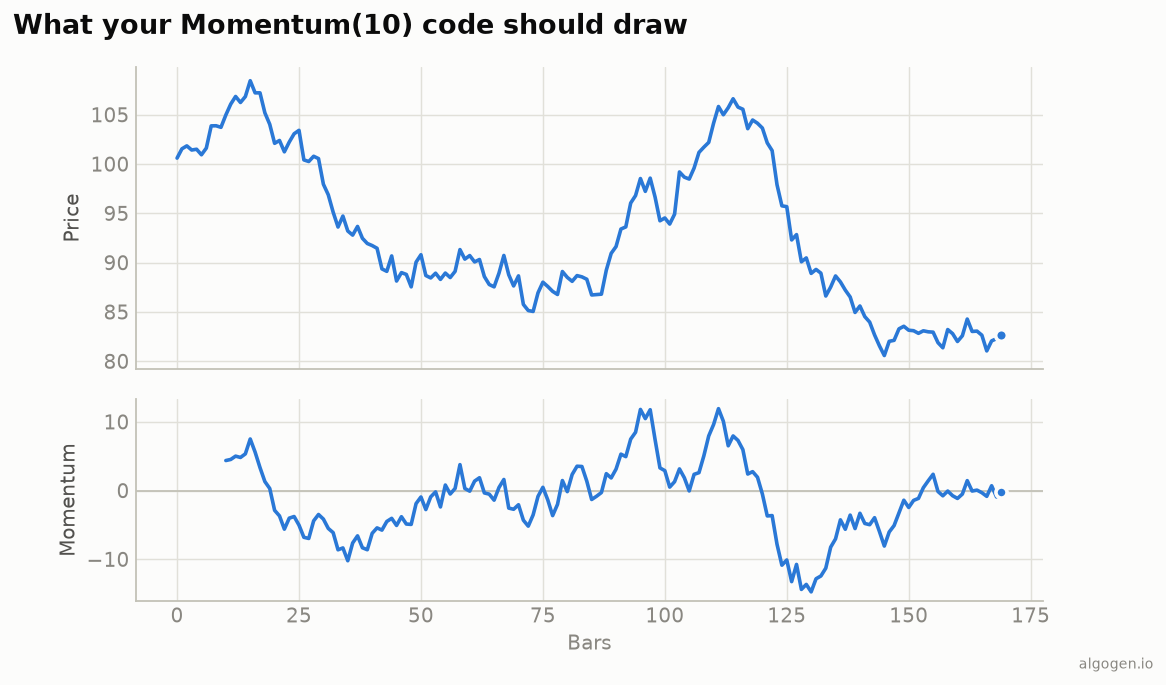
Momentum in EasyLanguage is a one-liner via the built-in Momentum function (or the
raw subtraction). See the explainer for the concept.
What you’ll need
- TradeStation or MultiCharts
- The EasyLanguage / PowerLanguage Editor, new Indicator
The source
{ AlgoGen Momentum — TradeStation / MultiCharts }
inputs:
    Length( 10 );

variables:
    MomVal( 0 );

MomVal = Momentum( Close, Length );   { = Close - Close[Length] }

Plot1( MomVal, "Momentum" );
Plot2( 0, "Zero" );

if MomVal >= 0 then SetPlotColor( 1, Green ) else SetPlotColor( 1, Red );
Momentum( Close, Length ) is the difference form (Close − Close[Length]),
oscillating around zero — the histogram from the output chart. You can also write it
by hand: Close - Close[Length].
A trend-filtered strategy
{ AlgoGen Momentum Cross — Strategy }
inputs: Length( 10 ), TrendLen( 200 );
variables: MomVal( 0 );
MomVal = Momentum( Close, Length );

{ Only take the zero-cross with the longer trend }
if MomVal crosses over 0 and Close > Average( Close, TrendLen ) then
    Buy next bar at market;
if MomVal crosses under 0 then
    Sell next bar at market;
Because Momentum has no fixed levels, pairing the zero-cross with a trend filter is the sensible test — the Strategy Performance Report shows if it helps.
Gotchas
- Difference form. EasyLanguage’s
Momentumreturns the absolute point change; for a percentage useRateOfChange(see the ROC post). - No fixed extremes. Don’t hard-code overbought/oversold; judge relative to recent range.
- Add smoothing (
Average( MomVal, 3 )) if the raw line is too jumpy for your signals. - Ratio form. For the 100-centered version, use
100 * Close / Close[Length]instead ofMomentum(...)— some traders prefer reading it around 100. - RadarScreen ranking. Momentum makes a natural RadarScreen column for ranking a watchlist by recent strength — the retail echo of the cross-sectional “momentum factor” from the history.
Same indicator elsewhere: Python, MQL5, Pine Script, NinjaScript. Then backtest it in AlgoGen.
This post is educational, not financial advice. Indicators describe the past; they don’t predict the future. Backtest anything before you risk real money on it.
Sources and further reading
- What is EasyLanguage? (TradeStation)