TradingView is where most people first meet the RSI, and Pine Script makes it almost embarrassingly easy to build your own. We’ll do it twice: the one-line built-in, and a from-scratch version so you can see there’s no magic — and so you can modify the smoothing if you ever want to.
What you’ll need
- A TradingView account (the free tier is fine)
- Open Pine Editor at the bottom of any chart
The built-in version
//@version=5
indicator("AlgoGen RSI", shorttitle="AG RSI", overlay=false, precision=2)

length = input.int(14, "RSI Length", minval=1)
src    = input.source(close, "Source")

rsiValue = ta.rsi(src, length)

plot(rsiValue, "RSI", color=color.new(#2a78d6, 0), linewidth=2)
hline(70, "Overbought", color=color.new(color.gray, 0))
hline(30, "Oversold",   color=color.new(color.gray, 0))
fill(hline(70), hline(100), color=color.new(#e34948, 90))
fill(hline(0),  hline(30),  color=color.new(#1baf7a, 90))
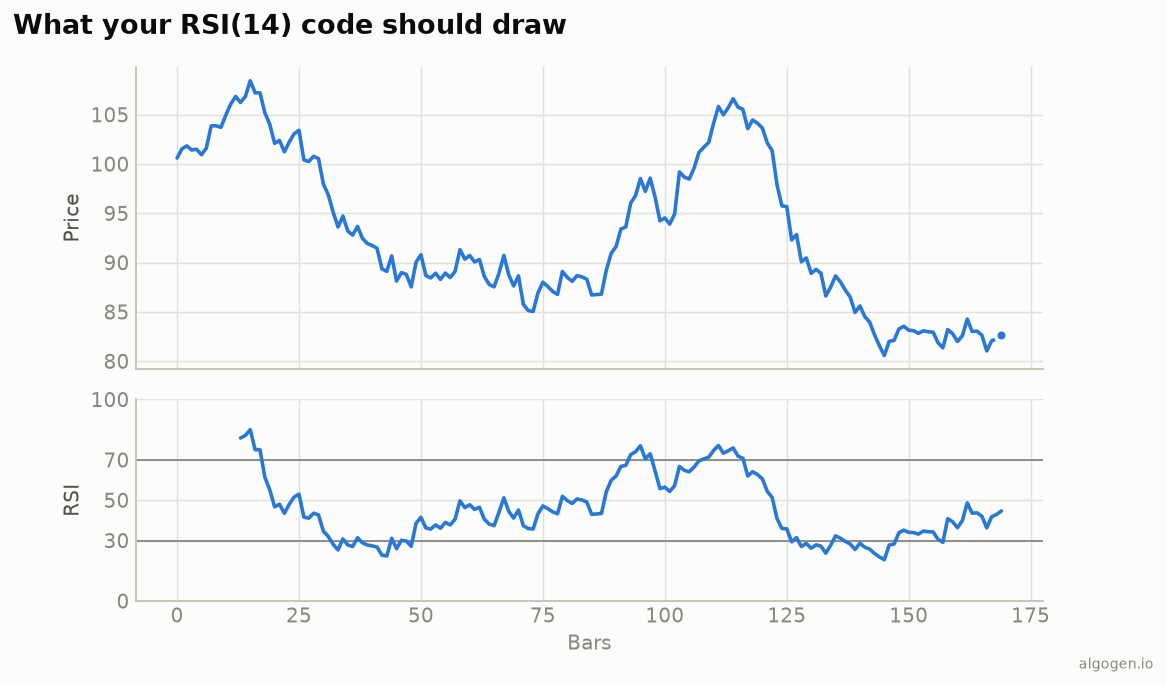
ta.rsi already uses Wilder’s smoothing internally, so this matches every other
implementation in the series out of the box. The two fill calls shade the
overbought and oversold zones, giving you the same look as the output chart
above.
The from-scratch version
Want to prove it to yourself, or swap in different smoothing? Here’s the RSI
without ta.rsi, using ta.rma — which is Wilder’s rolling average:
//@version=5
indicator("AlgoGen RSI (manual)", shorttitle="AG RSI m", precision=2)

length = input.int(14, "RSI Length", minval=1)

change = ta.change(close)
gain   = math.max(change, 0.0)
loss   = math.max(-change, 0.0)

avgGain = ta.rma(gain, length)   // rma == Wilder's smoothing
avgLoss = ta.rma(loss, length)

rsiValue = avgLoss == 0 ? 100 : 100 - (100 / (1 + avgGain / avgLoss))

plot(rsiValue, "RSI", color=#2a78d6, linewidth=2)
hline(70), hline(30)
Both plots sit exactly on top of each other. That’s the point: ta.rsi is just
this, wrapped up.
Adding it to your chart
- Paste either script into the Pine Editor.
- Click Add to chart.
- Adjust the length in the settings gear. Done.
Gotchas
ta.rmavsta.sma. If you build it from scratch withta.sma, you’ll get a simple-average RSI that won’t match TradingView’s built-in. Useta.rma. This is the Pine version of the same “wrong smoothing” bug we warn about everywhere.- Repainting. On the last, still-forming bar, RSI updates tick by tick until
the bar closes — that’s expected, not a bug. For alerts, gate on
barstate.isconfirmedif you only want closed-bar signals. - Colors. Pine’s
color.new(hex, transparency)takes transparency 0–100, where 90 is very faint — that’s what gives the soft zone fills.
Same RSI elsewhere: Python, MQL5, EasyLanguage, NinjaScript. And the only opinion that counts is the equity curve — test an RSI strategy in AlgoGen.
This post is educational, not financial advice. Indicators describe the past; they don’t predict the future. Backtest anything before you risk real money on it.
Sources and further reading
- New Concepts in Technical Trading Systems (Windsor Books)
- Pine Script built-ins (TradingView)