EasyLanguage is the granddaddy of retail systematic trading — the language that made “if RSI crosses above 30 then buy” something a non-programmer could actually write. It powers TradeStation and MultiCharts, and it reads almost like English. If you’re going to automate an RSI rule anywhere, this is a great place to see the logic spelled out plainly.
What you’ll need
- TradeStation or MultiCharts
- Open the EasyLanguage / PowerLanguage Editor, create a new Indicator
The built-in version
EasyLanguage has an RSI reserved word that already uses Wilder’s smoothing, so
the shortest correct study is tiny:
{ AlgoGen RSI — TradeStation / MultiCharts }
inputs:
    Price( Close ),
    Length( 14 ),
    OverBought( 70 ),
    OverSold( 30 );

variables:
    RSIValue( 0 );

RSIValue = RSI( Price, Length );

Plot1( RSIValue, "RSI" );
Plot2( OverBought, "OB" );
Plot3( OverSold, "OS" );

{ Optional background alerts }
if RSIValue crosses over OverSold then
    Alert( "RSI crossing up through oversold" )
else if RSIValue crosses under OverBought then
    Alert( "RSI crossing down through overbought" );
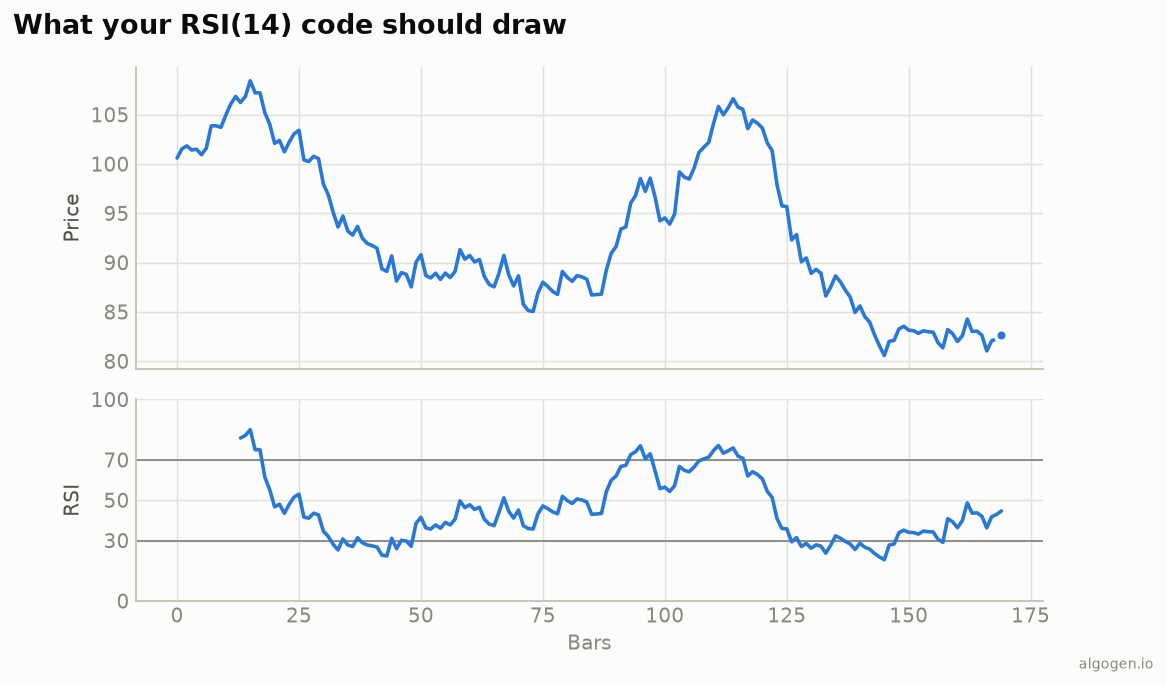
Apply it to a chart in a sub-graph and you get the RSI line plus the 70/30 guide plots — the same picture as the output chart above.
The from-scratch version
To see exactly what RSI() is doing — and to confirm the Wilder smoothing —
here’s the equivalent built by hand. Average seeds nicely and the recursive
lines below are Wilder’s 1/Length update:
{ AlgoGen RSI (manual) — shows the Wilder smoothing explicitly }
inputs:
    Price( Close ),
    Length( 14 );

variables:
    Chg( 0 ), GainAmt( 0 ), LossAmt( 0 ),
    AvgGain( 0 ), AvgLoss( 0 ), RS( 0 ), RSIValue( 0 );

Chg     = Price - Price[1];
GainAmt = MaxList( Chg, 0 );
LossAmt = MaxList( -Chg, 0 );

if CurrentBar <= Length then begin
    { Seed with a simple average over the first window }
    AvgGain = Average( GainAmt, Length );
    AvgLoss = Average( LossAmt, Length );
end
else begin
    AvgGain = ( AvgGain[1] * ( Length - 1 ) + GainAmt ) / Length;
    AvgLoss = ( AvgLoss[1] * ( Length - 1 ) + LossAmt ) / Length;
end;

if AvgLoss = 0 then
    RSIValue = 100
else begin
    RS = AvgGain / AvgLoss;
    RSIValue = 100 - ( 100 / ( 1 + RS ) );
end;

Plot1( RSIValue, "RSI" );
Verify & apply
- Paste into a new Indicator, press F3 (TradeStation) to verify — no errors expected.
- Right-click your chart → Insert Study / Indicator → choose it.
- Set it to plot in a sub-graph so the 0–100 scale has its own space.
Gotchas
CurrentBaris 1-based in EasyLanguage, and study calculation starts once there’s enough history (MaxBarsBackcovers theLengthlookback). TheCurrentBar <= Lengthseed guard handles the warm-up.MaxListbeatsIFFhere — it’s the clean way to split gains and losses without branching.- Reserved word vs manual will match to the penny; if they don’t, you edited the smoothing.
Same indicator, other platforms: Python, MQL5, Pine Script, NinjaScript. Then stop admiring the line and backtest an RSI rule in AlgoGen.
This post is educational, not financial advice. Indicators describe the past; they don’t predict the future. Backtest anything before you risk real money on it.
Sources and further reading
- New Concepts in Technical Trading Systems (Windsor Books)
- What is EasyLanguage? (TradeStation)