EasyLanguage practically reads like the sentence “average the last twenty closes,” which is fitting, because that’s the whole SMA. This is a perfect first study in TradeStation or MultiCharts. See the explainer for the concept; here’s the code.
What you’ll need
- TradeStation or MultiCharts
- The EasyLanguage / PowerLanguage Editor, new Indicator
The source
EasyLanguage has an Average reserved word that is the simple moving average,
so the two-line crossover study is short and readable:
{ AlgoGen SMA Crossover — TradeStation / MultiCharts }
inputs:
    Price( Close ),
    FastLen( 20 ),
    SlowLen( 50 );

variables:
    FastMA( 0 ),
    SlowMA( 0 );

FastMA = Average( Price, FastLen );
SlowMA = Average( Price, SlowLen );

Plot1( FastMA, "Fast SMA" );
Plot2( SlowMA, "Slow SMA" );

if FastMA crosses over SlowMA then
    Alert( "Golden cross" )
else if FastMA crosses under SlowMA then
    Alert( "Death cross" );
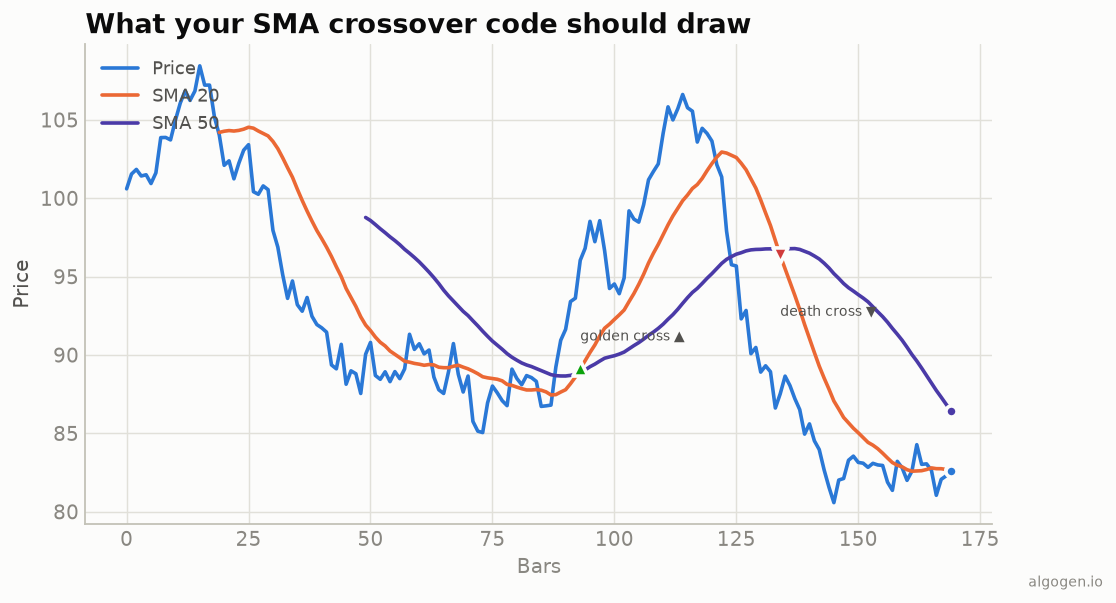
Average( Price, Length ) sums the last Length values of Price and divides —
equal weighting, exactly the SMA. The crosses over / crosses under operators
detect the golden and death crosses shown in the output chart.
Verify & apply
- Paste into a new Indicator, press F3 (TradeStation) to verify.
- Insert it on a chart. Because these plot on the price scale, apply it as an overlay (same sub-graph as price), not a separate pane.
Turning it into a backtest
The reason EasyLanguage exists isn’t to draw lines — it’s to test rules. The same crossover becomes a Strategy (not an Indicator) with almost the same code; you just swap the plots for order instructions:
{ AlgoGen SMA Crossover — Strategy version }
inputs: FastLen( 20 ), SlowLen( 50 );
variables: FastMA( 0 ), SlowMA( 0 );

FastMA = Average( Close, FastLen );
SlowMA = Average( Close, SlowLen );

if FastMA crosses over SlowMA then
    Buy ( "GoldenLE" ) next bar at market
else if FastMA crosses under SlowMA then
    SellShort ( "DeathSE" ) next bar at market;
Note the next bar at market — you decide on this bar’s close and act on the
next bar’s open, which avoids the look-ahead trap of assuming you could have
filled at the very price that triggered the signal. Apply it to a chart, open
the Strategy Performance Report, and let the numbers — not the pretty line —
decide whether the rule is worth anything.
Gotchas
AveragevsXAverage.Averageis the simple moving average;XAverageis the exponential one. Reach forXAveragewhen you want the EMA — the call looks nearly identical, so it’s an easy mix-up.MaxBarsBack. Make sure it’s at leastSlowLenso the longer average has enough history to compute; TradeStation usually auto-detects this.- Crossover on closed bars. By default study logic evaluates once per bar on bar close in most setups, which is what you want for clean crossover signals.
Same indicator elsewhere: Python, MQL5, Pine Script, NinjaScript. Then backtest it in AlgoGen.
This post is educational, not financial advice. Indicators describe the past; they don’t predict the future. Backtest anything before you risk real money on it.
Sources and further reading
- Gartley and the early use of moving averages (CMT Association)
- What is EasyLanguage? (TradeStation)