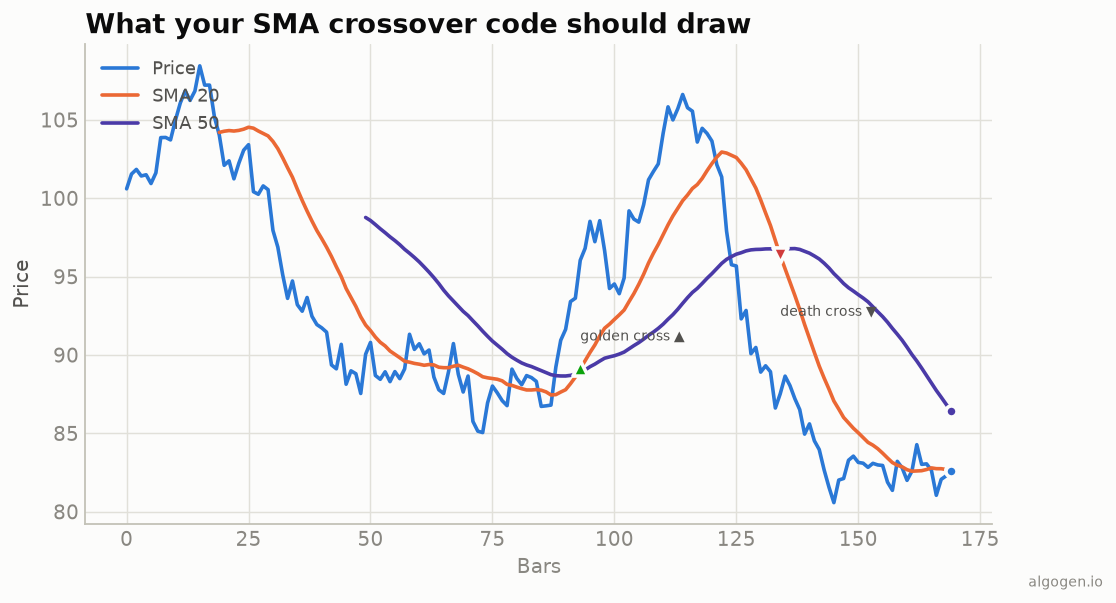
Pine Script was practically built for moving averages, and reproducing the crossover chart from the explainer takes about ten lines. We’ll plot two SMAs and mark the golden and death crosses.
What you’ll need
- A TradingView account (free tier is fine)
- The Pine Editor at the bottom of a chart
The source
//@version=5
indicator("AlgoGen SMA Crossover", shorttitle="AG SMA", overlay=true)

fastLen = input.int(20, "Fast SMA", minval=1)
slowLen = input.int(50, "Slow SMA", minval=1)

fast = ta.sma(close, fastLen)
slow = ta.sma(close, slowLen)

plot(fast, "Fast SMA", color=#eb6834, linewidth=2)
plot(slow, "Slow SMA", color=#4a3aa7, linewidth=2)

goldenCross = ta.crossover(fast, slow)
deathCross  = ta.crossunder(fast, slow)

plotshape(goldenCross, "Golden cross", shape.triangleup,   location.belowbar, color=#0ca30c, size=size.small)
plotshape(deathCross,  "Death cross",  shape.triangledown, location.abovebar, color=#d03b3b, size=size.small)
ta.sma(close, len) is the simple average — equal weight across the window, just
like every other version in this series. ta.crossover / ta.crossunder fire
true on the exact bar the fast line crosses the slow one, and plotshape drops
the triangles you see in the output chart.
Adding it to your chart
- Paste into the Pine Editor.
- Click Add to chart — because
overlay=true, it draws on price, not in a sub-pane. - Tune the two lengths in settings.
Going further: a higher-timeframe SMA
One genuinely useful upgrade is plotting a higher-timeframe SMA on a
lower-timeframe chart — say the daily 50-SMA while you trade the 1-hour. Pine
makes that a one-liner with request.security:
htfSma = request.security(syminfo.tickerid, "D", ta.sma(close, 50), lookahead=barmerge.lookahead_off)
plot(htfSma, "Daily SMA 50", color=#4a3aa7, linewidth=2)
The lookahead_off argument is not optional decoration — it stops the higher
timeframe from leaking future data onto historical bars, which is the single
most common way people accidentally build a backtest that “works” and then fails
live. Always keep it off unless you have a very specific reason not to.
Gotchas
ta.smavsta.ema.ta.smaweights every bar equally. Swap tota.emafor the exponential version — different line, same call shape.- Series length.
ta.sma(close, len)returnsnauntillenbars exist. Don’t feed thosenavalues into downstream logic without a guard. - Alerts. Wrap the crosses in
alertcondition(goldenCross, ...)to get TradingView alerts, and gate onbarstate.isconfirmedif you only want signals on closed bars (avoids intrabar flip-flop). - Repaint myth. A closed-bar SMA does not repaint; only the still-forming last bar updates, which is expected.
Same indicator elsewhere: Python, MQL5, EasyLanguage, NinjaScript. Then test the crossover in AlgoGen.
This post is educational, not financial advice. Indicators describe the past; they don’t predict the future. Backtest anything before you risk real money on it.
Sources and further reading
- Gartley and the early use of moving averages (CMT Association)
- Pine Script built-ins (TradingView)