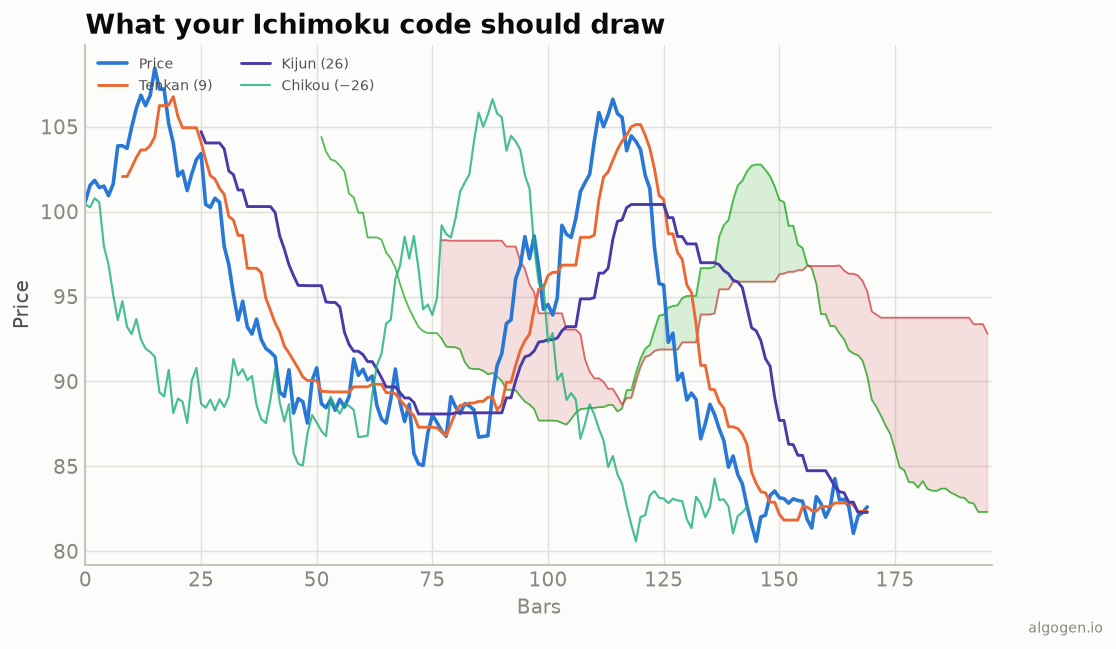
Ichimoku looks like the hardest indicator in this series to code, but it’s really just five midpoints and two time shifts, as the explainer covered. The only thing to get exactly right is which way each line is displaced.
What you’ll need
- Python 3.9+,
pandas high,low,closeseries.
All five lines
import pandas as pd


def ichimoku(high, low, close, conv=9, base=26, span_b=52, shift=26):
    def midline(n):
        return (high.rolling(n).max() + low.rolling(n).min()) / 2

    tenkan = midline(conv)          # Conversion line (9)
    kijun  = midline(base)          # Base line (26)

    senkou_a = ((tenkan + kijun) / 2).shift(shift)   # Leading Span A, 26 FORWARD
    senkou_b = midline(span_b).shift(shift)          # Leading Span B, 26 FORWARD
    chikou   = close.shift(-shift)                   # Lagging Span, 26 BACK

    return pd.DataFrame({
        "tenkan": tenkan, "kijun": kijun,
        "senkou_a": senkou_a, "senkou_b": senkou_b, "chikou": chikou,
    })
Every line is (highest high + lowest low) / 2 over some window — even Span B.
The only subtlety is the displacement: the two Senkou spans are shifted
forward (+shift) so the cloud projects ahead, and the Chikou is shifted
backward (−shift). Get the sign wrong and everything looks plausible but is
subtly useless.
Reading the cloud in code
ich = ichimoku(df["high"], df["low"], df["close"])
cloud_top = ich[["senkou_a", "senkou_b"]].max(axis=1)
cloud_bot = ich[["senkou_a", "senkou_b"]].min(axis=1)

df["above_cloud"] = df["close"] > cloud_top     # bullish bias
df["below_cloud"] = df["close"] < cloud_bot     # bearish bias
df["tk_bull"] = (ich["tenkan"] > ich["kijun"]) & (ich["tenkan"].shift(1) <= ich["kijun"].shift(1))
Now above_cloud & tk_bull is a concrete “aligned bullish” condition to
backtest in AlgoGen.
Gotchas
- Displacement direction. Spans forward (
.shift(+26)), Chikou back (.shift(-26)). This is the #1 Ichimoku bug. - The future cloud has no price yet.
senkou_a/bextend 26 bars beyond your last close — those rows are the projected cloud and there’s no price to compare them to until time catches up. That’s expected, not missing data. - Backtesting the Chikou. Because it’s shifted back, comparing Chikou to price is really comparing today’s close to price 26 bars ago — don’t accidentally introduce look-ahead by testing it against future bars.
Cloud thickness and twists
Two more reads that are trivial once you have the spans. Cloud thickness proxies the strength of support/resistance, and a twist (spans crossing) flags a projected trend change:
thickness = (ich["senkou_a"] - ich["senkou_b"]).abs()
twist_bull = (ich["senkou_a"] > ich["senkou_b"]) & (ich["senkou_a"].shift(1) <= ich["senkou_b"].shift(1))
Because both spans are already shifted forward, these series naturally align with
the projected cloud — a thick cloud ahead means a stronger barrier, and a fresh
twist_bull marks where the future cloud flips green.
The lazy one-liner
import pandas_ta as ta
df.ta.ichimoku(append=True)   # returns the visible lines plus the forward spans
Same indicator elsewhere: MQL5, Pine Script, EasyLanguage, NinjaScript.
This post is educational, not financial advice. Indicators describe the past; they don’t predict the future. Backtest anything before you risk real money on it.
Sources and further reading
- Ichimoku: At a Glance (CMT Association)
- Windowing operations (pandas documentation)