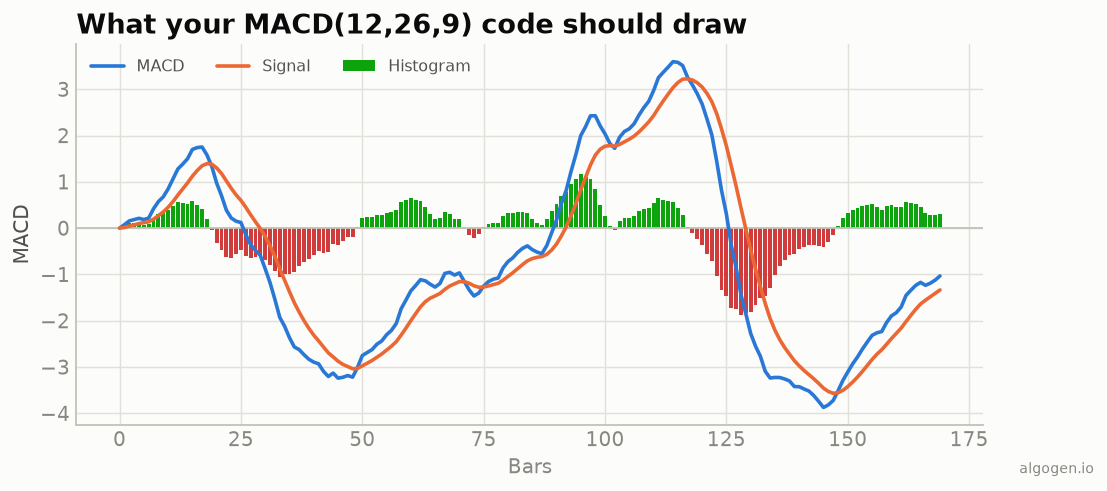
The MACD sounds fancy but, as the explainer showed, it’s three lines built from exponential moving averages. If you can compute an EMA in pandas — and you can, it’s one method call — you can compute the whole MACD in about five lines.
What you’ll need
- Python 3.9+,
pandas(pip install pandas) - A
closeprice series.
The from-scratch version
pandas’ ewm(span=n, adjust=False).mean() is exactly the recursive EMA with
alpha = 2/(n+1), which is what MACD uses. So:
import pandas as pd


def macd(close: pd.Series, fast: int = 12, slow: int = 26, signal: int = 9):
    ema_fast = close.ewm(span=fast, adjust=False).mean()
    ema_slow = close.ewm(span=slow, adjust=False).mean()

    macd_line = ema_fast - ema_slow
    signal_line = macd_line.ewm(span=signal, adjust=False).mean()
    histogram = macd_line - signal_line

    return pd.DataFrame(
        {"macd": macd_line, "signal": signal_line, "hist": histogram}
    )
That’s the entire indicator — the MACD line, its signal, and the histogram, all matching the chart above.
The signal-cross detector
The most-traded MACD event is the MACD line crossing its signal line:
m = macd(df["close"])
above = m["macd"] > m["signal"]
df["bull_cross"] = above & ~above.shift(1, fill_value=False)   # momentum up
df["bear_cross"] = ~above & above.shift(1, fill_value=False)    # momentum down
Those booleans are the seed of a strategy — which you should backtest in AlgoGen before believing a single crossover.
Gotchas
adjust=Falsematters. Withadjust=True(the pandas default) you get a different, bias-corrected weighting that is not the standard EMA. Keep itFalsefor all three EMAs.- Signal is an EMA of the MACD line, not of price. A surprising number of buggy implementations smooth the price again instead of smoothing the MACD line. Smooth the MACD line.
- EMA seeding.
ewm(adjust=False)seeds on the first value. Some platforms seed their EMA with an SMA instead, so the first ~30 bars can differ by a hair before everything converges. It doesn’t matter for anything past the warm-up.
A useful variant: the percentage MACD
One practical gripe with the raw MACD is that its scale depends on the price, so you can’t compare a $30 stock’s MACD to a $3,000 one. The fix is a one-line tweak — divide the difference by the slow EMA to express it as a percentage:
ppo = 100 * (ema_fast - ema_slow) / ema_slow # "Percentage Price Oscillator"
That’s the PPO, and it’s genuinely handy when you want to screen many instruments with one threshold. Same shape as the MACD, comparable across assets.
The lazy one-liner
import pandas_ta as ta
df.ta.macd(fast=12, slow=26, signal=9, append=True)   # adds MACD_12_26_9 columns
Same indicator elsewhere: MQL5, Pine Script, EasyLanguage, NinjaScript.
This post is educational, not financial advice. Indicators describe the past; they don’t predict the future. Backtest anything before you risk real money on it.
Sources and further reading
- Gerald Appel (CMT Association)
- Windowing operations (pandas documentation)