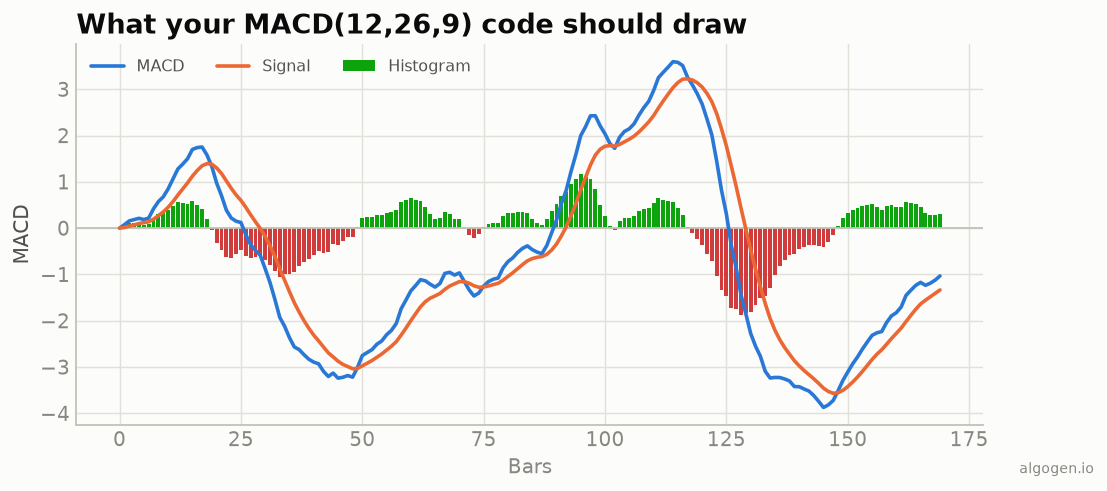
Pine Script has a dedicated ta.macd that hands you all three components in one
call, so reproducing the MACD panel from the explainer
is quick. We’ll do the built-in version, then the from-scratch one, and add the
classic four-colour histogram.
What you’ll need
- A TradingView account (free tier is fine)
- The Pine Editor
The built-in version
//@version=5
indicator("AlgoGen MACD", shorttitle="AG MACD", overlay=false)

fastLen   = input.int(12, "Fast length")
slowLen   = input.int(26, "Slow length")
signalLen = input.int(9,  "Signal length")

[macdLine, signalLine, histLine] = ta.macd(close, fastLen, slowLen, signalLen)

// Four-colour histogram: brighter when growing, muted when shrinking.
histUp   = histLine >= 0
growing  = histLine >= histLine[1]
histCol  = histUp ? (growing ? #0ca30c : #a6e0a6) : (growing ? #f0a6a6 : #d03b3b)

plot(histLine,   "Histogram", style=plot.style_columns, color=histCol)
plot(macdLine,   "MACD",   color=#2a78d6, linewidth=2)
plot(signalLine, "Signal", color=#eb6834, linewidth=2)
hline(0, "Zero", color=color.gray)
ta.macd returns the MACD line, the signal line, and the histogram as a tuple —
exactly the three series in the output chart. The four-colour trick shades the
histogram by whether it’s above/below zero and growing/shrinking, which is a
popular way to see momentum acceleration at a glance.
The from-scratch version
Nothing hidden — ta.ema is the same recursive EMA:
//@version=5
indicator("AlgoGen MACD (manual)", overlay=false)
macdLine   = ta.ema(close, 12) - ta.ema(close, 26)
signalLine = ta.ema(macdLine, 9)
plot(macdLine - signalLine, "Histogram", style=plot.style_columns)
plot(macdLine, color=#2a78d6, linewidth=2)
plot(signalLine, color=#eb6834, linewidth=2)
Adding it and getting alerts
- Paste into the Pine Editor and Add to chart (it opens in its own pane).
- For a signal-cross alert:
alertcondition(ta.crossover(macdLine, signalLine),  "MACD bull cross", "MACD crossed up")
alertcondition(ta.crossunder(macdLine, signalLine), "MACD bear cross", "MACD crossed down")
Watch the tuple order
A classic Pine footgun: ta.macd returns the three series in the order
[macdLine, signalLine, histLine]. Swap two of those names by accident and your
“MACD” plot is silently the signal line, or your histogram is doubled. Destructure
it in that exact order, and sanity-check against the output chart above — the
histogram should be zero exactly where the MACD and signal lines touch.
Gotchas
- Signal smooths the MACD line, not price.
ta.macdhandles this for you; in the manual version make sureta.ema’s input ismacdLine. - Closed-bar signals. Gate crossover alerts on
barstate.isconfirmedto avoid intrabar flip-flopping. - EMA seeding. Pine’s
ta.emamay differ from other platforms by a hair in the first bars due to seeding, then converges — normal, not a bug.
Same indicator elsewhere: Python, MQL5, EasyLanguage, NinjaScript. Then test it in AlgoGen.
This post is educational, not financial advice. Indicators describe the past; they don’t predict the future. Backtest anything before you risk real money on it.
Sources and further reading
- Gerald Appel (CMT Association)
- Pine Script built-ins (TradingView)