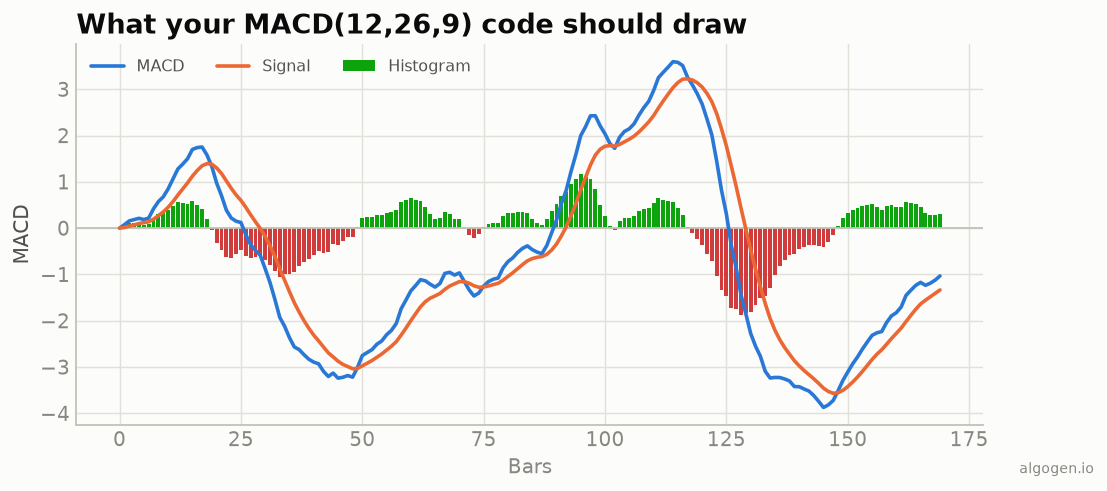
Building the MACD in NinjaScript is a good step up from the SMA: three plots, two intermediate EMA series, and a histogram you colour by sign. It’s still short, and it teaches the pattern you’ll reuse for every multi-line indicator. See the explainer for what we’re drawing.
What you’ll need
- NinjaTrader 8
- New → NinjaScript Editor → Indicators → New Indicator, name it
AlgoGenMACD
The source
We keep the two price EMAs and the signal EMA as Series<double> so their
recursion survives reloads, then colour the histogram per bar.
#region Using declarations
using System;
using System.Windows.Media;
using NinjaTrader.NinjaScript;
using NinjaTrader.NinjaScript.Indicators;
#endregion

namespace NinjaTrader.NinjaScript.Indicators
{
    public class AlgoGenMACD : Indicator
    {
        private Series<double> emaFast;
        private Series<double> emaSlow;

        protected override void OnStateChange()
        {
            if (State == State.SetDefaults)
            {
                Name        = "AlgoGen MACD";
                Description = "MACD line, signal and histogram";
                Fast = 12; Slow = 26; Signal = 9;
                IsOverlay = false;

                AddPlot(new Stroke(Brushes.MediumSeaGreen, 2), PlotStyle.Bar,  "Histogram");
                AddPlot(new Stroke(Brushes.DodgerBlue, 2),     PlotStyle.Line, "Macd");
                AddPlot(new Stroke(Brushes.OrangeRed, 2),      PlotStyle.Line, "Signal");
                AddLine(Brushes.Gray, 0, "Zero");
            }
            else if (State == State.DataLoaded)
            {
                emaFast = new Series<double>(this);
                emaSlow = new Series<double>(this);
            }
        }

        private static double Ema(double price, double prev, int period, bool first)
        {
            double k = 2.0 / (period + 1.0);
            return first ? price : price * k + prev * (1.0 - k);
        }

        protected override void OnBarUpdate()
        {
            bool first = CurrentBar == 0;
            emaFast[0] = Ema(Close[0], first ? 0 : emaFast[1], Fast, first);
            emaSlow[0] = Ema(Close[0], first ? 0 : emaSlow[1], Slow, first);

            Macd[0]   = emaFast[0] - emaSlow[0];
            Signal[0] = Ema(Macd[0], first ? 0 : Signal[1], SignalPeriod, first);
            Histogram[0] = Macd[0] - Signal[0];

            PlotBrushes[0][0] = Histogram[0] >= 0 ? Brushes.MediumSeaGreen : Brushes.IndianRed;
        }

        #region Properties
        [NinjaScriptProperty] [System.ComponentModel.DataAnnotations.Range(1, int.MaxValue)]
        [System.ComponentModel.Display(Name = "Fast", GroupName = "Parameters", Order = 0)]
        public int Fast { get; set; }

        [NinjaScriptProperty] [System.ComponentModel.DataAnnotations.Range(1, int.MaxValue)]
        [System.ComponentModel.Display(Name = "Slow", GroupName = "Parameters", Order = 1)]
        public int Slow { get; set; }

        [NinjaScriptProperty] [System.ComponentModel.DataAnnotations.Range(1, int.MaxValue)]
        [System.ComponentModel.Display(Name = "Signal", GroupName = "Parameters", Order = 2)]
        public int SignalPeriod { get => Signal; set => Signal = value; }
        public int Signal { get; set; }

        [Gui.Browsable(false)] [System.Xml.Serialization.XmlIgnore]
        public Series<double> Histogram => Values[0];
        [Gui.Browsable(false)] [System.Xml.Serialization.XmlIgnore]
        public Series<double> Macd => Values[1];
        [Gui.Browsable(false)] [System.Xml.Serialization.XmlIgnore]
        public Series<double> SignalLine => Values[2];
        #endregion
    }
}
Compile & apply
- Press F5 to compile.
- Add AlgoGen MACD to a chart. It draws in its own panel: green/red histogram, blue MACD line, orange signal line — the output chart above.
Gotchas
Signalthe plot vsSignalthe input. NinjaScript gets prickly about name collisions; here the publicSignalLineplot isValues[2]while the integer input is exposed viaSignalPeriod. Rename freely, just keep them distinct.PlotBrushes[plotIndex][barsAgo]is how you colour a single bar of a plot — index 0 is the histogram plot, bar 0 is the current bar.- EMA seeding. We seed each EMA with its first value; NinjaTrader’s built-in
EMA()/MACD()may seed slightly differently, so expect tiny warm-up differences that vanish after ~30 bars.
That’s the five-language set: Python, MQL5, Pine Script, EasyLanguage, and this one. Now see whether a MACD cross beats buy-and-hold in AlgoGen.
This post is educational, not financial advice. Indicators describe the past; they don’t predict the future. Backtest anything before you risk real money on it.
Sources and further reading
- Gerald Appel (CMT Association)
- NinjaScript system indicator methods (NinjaTrader)